

Article Figures & Data
Figures
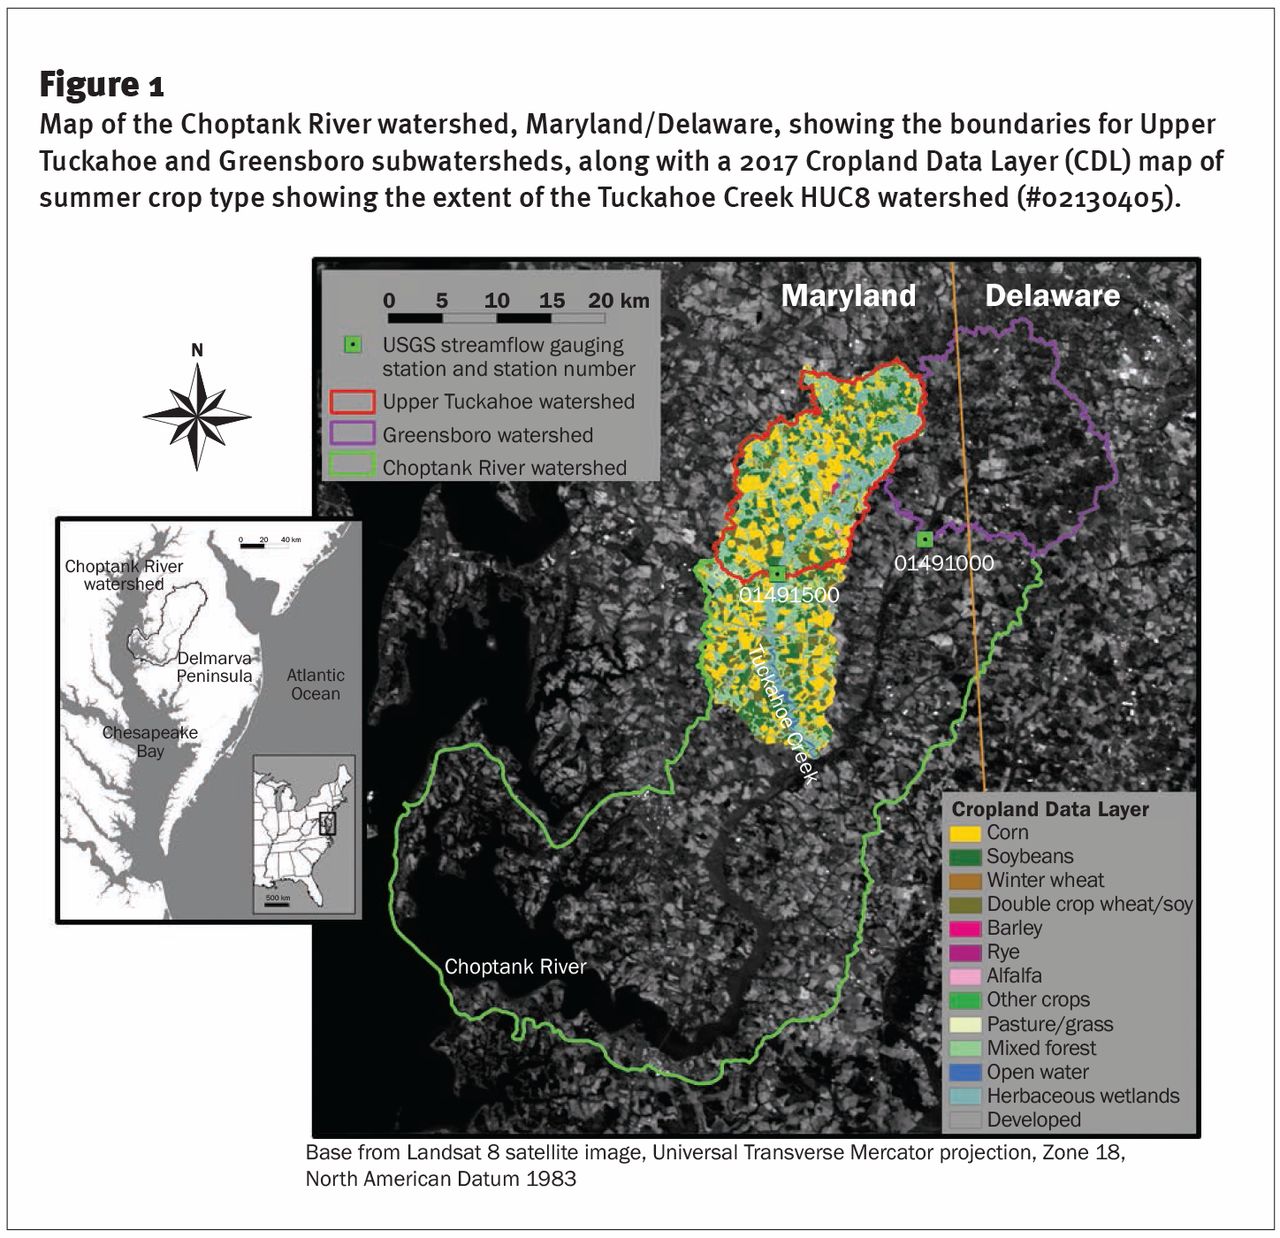
- Figure 1
Map of the Choptank River watershed, Maryland/Delaware, showing the boundaries for Upper Tuckahoe and Greensboro subwatersheds, along with a 2017 Cropland Data Layer (CDL) map of summer crop type showing the extent of the Tuckahoe Creek HUC8 watershed (#02130405).
- Figure 2
Annual area of summer row crops determined using Cropland Data Layer (CDL), annual area of planted cover crops, and percentage of summer row crop fields enrolled in the Maryland cover crop cost-share program, Tuckahoe Creek watershed, 2008 to 2017.
- Figure 3
Annual wintertime vegetation classification for cropland within the Tuckahoe Creek watershed from 2008 through 2017, based upon composite satellite Normalized Difference Vegetation Index (NDVI) threshold values for minimal, low, medium, and high levels of green vegetation.
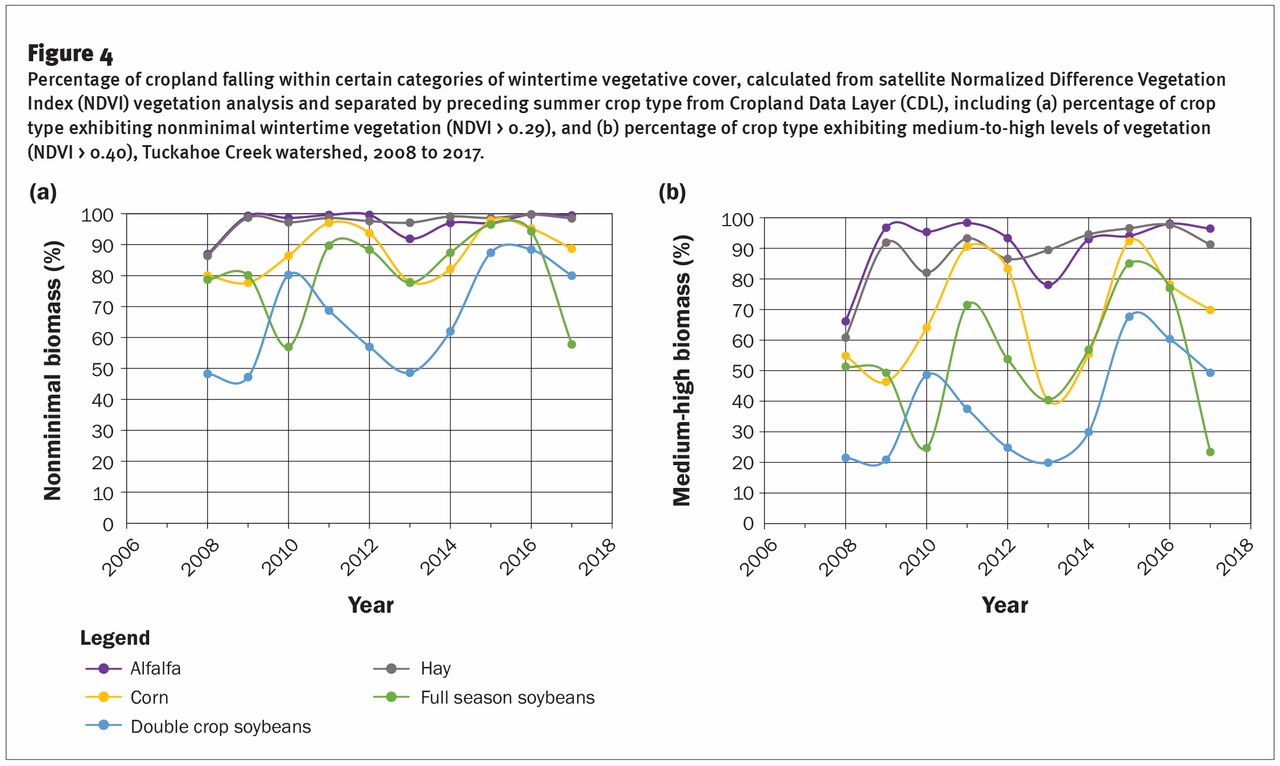
- Figure 4
Percentage of cropland falling within certain categories of wintertime vegetative cover, calculated from satellite Normalized Difference Vegetation Index (NDVI) vegetation analysis and separated by preceding summer crop type from Cropland Data Layer (CDL), including (a) percentage of crop type exhibiting nonminimal wintertime vegetation (NDVI > 0.29), and (b) percentage of crop type exhibiting medium-to-high levels of vegetation (NDVI > 0.40), Tuckahoe Creek watershed, 2008 to 2017.
- Figure 5
Percentage of cropland falling within certain categories of wintertime vegetative cover for (a) all row crops and (b) corn crops, calculated from satellite vegetation analysis, with growing degrees (base 4°C, GDD4) accumulated between November 15 and March 1, Tuckahoe Creek watershed, 2008 to 2017.
- Figure 6
(a) Percentage of long-term cropland in the Tuckahoe Creek watershed exhibiting medium-high levels of vegetation (NDVI > 0.4) calculated from satellite vegetation analysis, with growing degrees (base 4°C, GDD4 divided by 5 for display purposes) accumulated between November 15 and March 1, for three time periods of increasing winter cover crop (WCC) implementation (1984 to 1997; 1998 to 2009; 2010 to 2017); and (b) relationship between the percentage of long-term cropland exhibiting medium-high levels of vegetation and accumulated wintertime growing degrees (GDD4) for three time periods of increasing WCC implementation.
- Figure 7
Ten-year average (2008 to 2017) of nitrate leaching under the baseline (NoWCC) and nine winter cover crop (WCC) scenarios during the winter period (Sept. 1 to Mar. 31): early wheat (WE), early barley (BE), early rye (RE), standard wheat (WS), standard barley (BS), standard rye (RS), late wheat (WL), late barley (BL), and late rye (RL). Error bars indicate one standard deviation from 10-year mean.


