

Vegetated riparian buffers can trap and treat pollutants in runoff from agricultural uplands, thereby protecting stream water quality and the integrity of aquatic systems (Liu et al. 2008; Dosskey et al. 2010). The effectiveness of a buffer in achieving these goals depends on buffer design, buffer extent (i.e., stream length occupied), distributions of hydrologic flows through the buffer in time and space, and the conservation management of upslope agricultural lands. Soil survey and topographic data can be used to prioritize buffer implementation, and to design buffers that effectively intercept surface and/or subsurface flow paths according to landscape characteristics (Tomer et al. 2015; Schultz et al. 2009). However, buffer effectiveness can be enhanced through conservation management of agricultural uplands, using (as examples) zero/zonal tillage, field borders, and/or contour buffers, practices that can attenuate peak runoff flows that may bypass buffer vegetation (Dabney et al. 2006). In other words, riparian buffer performance depends on the use of upland practices that can effectively reduce erosion and slow or detain runoff from uplands. Benefits of integrated strategies for co-managing upland and riparian systems at watershed scale have been discussed, but no framework has been suggested to enable full landscape planning to be undertaken in an extensive yet detailed way. A methodology for landscape analysis that provides a way to prioritize landscape features and connect conservation opportunities across a watershed is needed. Modeling studies of large river basins have concluded that comprehensive, landscape and watershed-specific approaches will be required to achieve ambitious water quality goals (Bosch et al. 2013; Sharpley et al. 2009).
The availability of extensive, high-resolution landscape data, with information on soils, land use, and topography, enables technologies for visualizing hydrologic pathways, and locations along those pathways where “trap and treat” conservation practices can slow flows and retard movement of sediment and nutrients (Tomer et al. 2013). However, conservation aimed at water resource protection may require multiple practices, placed in series along water flow pathways, to account for tradeoffs among contaminants (Joosse and Baker 2011; Sharpley et al. 2009) and for increasing risks associated with extreme precipitation events under a changing climate (Garbrecht et al. 2014). In short, effective coupling of upland and riparian conservation as a system of practices, may become necessary to ensure water quality, water supply, agricultural sustainability, and ecosystem biodiversity and integrity. This is not an easy task, nor an intuitive one. Therefore, an approach is needed that helps planners and stakeholders visualize strategies to place conservation practices in sequences that are adapted to landscape-specific attributes. Here, we present such an approach, called riparian catchments, which has been included in the Agricultural Conservation Planning Framework (ACPF) Version 3 ArcGIS toolbox (Porter et al. 2018).
APPROACH
Landscapes are often considered in a generic fashion with upland, hillslope, riparian/streamside, and aquatic components. We understand that landscapes commonly contain these component features and that management needs and options will change when shifting from one landscape component to the next. But how can this understanding be applied with a precise, local context? Our approach is based on a partitioning of the landscape achieved through watershed delineation and a focus on landscape hydrology. Watershed delineation, simply put, is identifying the boundary of a watershed, i.e., specifying the area of land that can contribute overland flows to a stream/river at a given location. Watershed managers understand that the definition of a watershed depends on where, i.e., what specific point along a watercourse, is considered the outlet (or pour point) of the watershed. This is an arbitrary choice; while an outlet is often defined at a stream confluence, outlets are also frequently defined as the location of a stream monitoring gage station. Stream gage locations are typically selected, at least in part, because of ease of access. The riparian catchments approach leverages this arbitrary aspect of watershed definition. The process defines many watershed outlets, along individual segments throughout a stream network. A nominal segment length is selected and then segments are fitted along each stream reach. Watersheds are then delineated to each segment, moving stepwise through the entire stream network, and then the stream line is used to split each of these incremental subcatchment land areas in two, one above each bank of the stream. Once divided by the stream, each riparian catchment delineates the area that is upgradient of a riparian length of the stream. The ACPF Version 3 riparian catchments tool includes a system to create, catalogue, and characterize/attribute riparian catchments across a watershed. Upon discretizing the landscape this way, a number of potential applications for landscape analysis are available. Riparian catchments are landscape units delineated through digital terrain analysis, which can be prioritized by considering attributes of terrain, soil, and/or land use as a part of watershed assessment. Co-characterization of riparian and upland areas to define landscape-customized conservation options also becomes feasible. This article presents detail on the riparian catchments tool in the ACPF Version 3 toolbox (Porter et al. 2018) and presents results of example applications in a selected watershed. The approach enables the conservation planner to focus on natural landscape features in initial resource conservation assessment/prioritization and, optionally, during early stakeholder engagement efforts. Agricultural field boundaries are fully retained in the ACPF database structure as described for prior versions (Tomer et al. 2017).
PROCESS
Riparian practices, by definition, are placed to protect perennial streams and water bodies, and particularly, the aquatic organisms and habitats found there (National Research Council 2002). An early step in the development of ACPF watershed datasets, which is completed by the user, is to define those reaches of a watershed's network of flow paths that comprise the perennial stream network. Managing ephemeral and intermittent waterways for conservation outcomes is important, but the designation of perennial streams is necessary to help define where riparian management can protect the aquatic component of the watershed ecosystem. High-resolution terrain data and aerial photography can be used to discern perennial from nonperennial channels, although field reviews may be necessary to ensure accuracy in many cases. The ACPF User Manual (Porter et al. 2018) provides detailed steps on the process for defining a watershed's perennial stream network.
Many watersheds include lakes and/or wide rivers that may be poorly represented in high-resolution digital elevation models (DEMs) derived from light detection and ranging (LiDAR) surveys. The LiDAR technology is high-speed, airborne, laser altimetry of the land surface, and has provided high-resolution elevation data across much of the United States. Results of these surveys have often been posted for public access, but ACPF users should use caution when importing DEMs processed without specific regard to ensuring speed and accuracy in conducting hydrologic analyses of the DEM. One common issue is that LiDAR pulses are not returned from water surfaces, requiring water surface elevations to be interpolated using data obtained near the edge of the water body. Processes such as “hydro-flattening” can improve the output. The real issue arises in hydrologic processing of the terrain data, which shows flowpaths as a connected set of line segments, without indicating areas covered by water. Where flow paths encounter a water body, the surface has no slope, and flow paths across that water body are (typically) estimated by a recursive interpolation routine (Garbrecht and Martz 1997) that searches for lower elevations at the edge of the water body. The outcome in terms of flow routing towards the outlet of the water body is accurate (figure 1a), but the placement of pathways across the water body, in terms of managing perennial water bodies, is artefactual and meaningless. To enable riparian assessments that include shorelines of wide, perennial water features, a method of merging water body polygons into the perennial stream network has been incorporated into ACPF Version 3 (figures 1b and 1c). The option to merge water bodies can comprise wide rivers, and/or lakes; even small ponds that are not connected to a perennial stream can be included. Nominally, rivers wider than 7 to 10 m may be considered for merging of shore polyline features into the stream network (written communication, Iowa Department of Natural Resources, June 3, 2009).
In prior versions of the ACPF, the riparian assessment was conducted utilizing the “strip-map-index” feature within ArcGIS, which presented results of the riparian analysis within a series of 250 by 180 m (820 by 590 ft) “boxes” that were fitted along the stream network (Tomer et al. 2015). While workable, the process resulted in data gaps near confluences and points of stream initiation. The riparian catchments tool eliminates this lack of completeness. To begin, the user identifies a nominal riparian length that will be used to segment the perennial stream network for analysis. This nominal length can be chosen between 100 and 500 m (328 and 1,640 ft); the default of 250 m is inherited from previous ACPF versions. In selecting this length, note each incorporated water body should have a shoreline at least twice the length chosen in order to be included in the processing. The flow-path distance of each riparian reach (and length of each shoreline-reach of any water bodies) is found; reaches are defined from stream initiation points of first order streams to the next downstream confluence (figure 2a), and then between subsequent stream confluences throughout the perennial network. The number of segments of the chosen length that can be fit along each reach is determined, with one added if the remainder of the division (of segment length into stream reach) is greater than 0.5. The reach is then segmented through a two-step procedure. The first step places points along the stream polyline to divide each reach equally into the number of (nominally) 250 m length sections, without leaving gaps (figure 2b). Second, there is an interpolation used to adjust the position of each segment, which is based on the sinuosity of the stream along that segment (figure 2c). This step shortens the segment length along straight stream segments and lengthens the segments along the more sinuous sections of each stream reach, reducing the variability of straight-line distances among the reach segments.

Three images illustrating the merging of water bodies into an Agricultural Conservation Planning Framework stream network: (a) flow routing across two lakes (note there are parallel lines crossing lake surface in places); (b) the flow paths are replaced by shorelines in the stream network to facilitate riparian analysis; (c) output from example with bank lines of a wide river similarly merged with stream network.

Four images illustrating delineation of riparian segments and formation of riparian catchments: (a) part of stream network with points delimiting stream reaches, and inset box for subsequent images; (b) initial stream segments found by dividing reach into equal lengths; (c) stream segments are adjusted to reduce variation in straight-line lengths; (d) landscape is divided into riparian catchments, shaded to highlight headwaters (yellow), right-side (brown), and left-side (green) catchments (see text).
The adjusted stream segments are then used to delineate watershed areas. Essentially, this process defines the incremental watershed contributing areas to each grid cell along the stream network and assembles the incremental areas by segment. The resulting subwatershed areas are split in two using the stream polyline (figure 2d), forming a right and left component. A similar approach was presented by Jensco et al. (2010), but the ACPF riparian catchments assemble the results by segment to generate a network of manageable riparian lengths. At the initiation (uppermost) point of each first order stream, the contributing area is also delineated and labelled as a headwater basin. The process, once completed, provides a set of defined riparian lengths and, for each side of the stream for each riparian length, a riparian catchment that defines where surface runoff contributions to each riparian length may originate (depending on the magnitude of runoff). The riparian catchment comprises riparian and upland components of the landscape, discretized into a length of riparian zone as specified by the user/watershed analyst. To enable display of attributes/characteristics of both uplands and riparian zones in map products, a set of riparian attribute polygons (or RAPs) can be generated, which are 15 m (49 ft) wide polygons, placed adjacent to the stream. Each RAP is associated with and linked to its riparian catchment by a common identifier, which follow an A-B-C format with A identifying the stream reach, B providing a counter of the riparian segments for each reach, and C signifying stream side, i.e., 1 for right side and 2 for left side of the stream.
EXAMPLE APPLICATIONS
A range of applications to help planners visualize and understand riparian management options and priorities are possible using riparian catchment delineations and their RAPs.
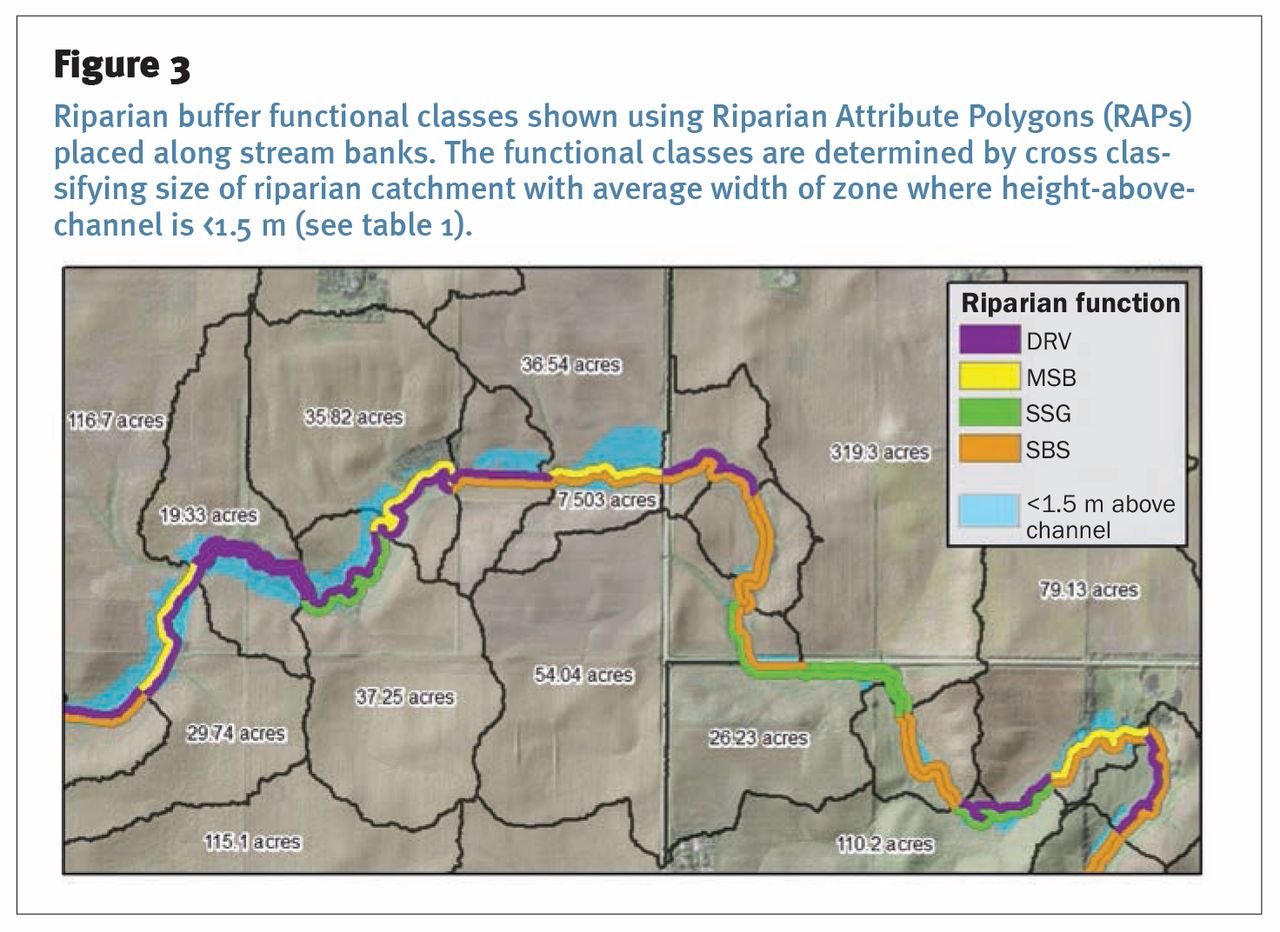
Riparian Buffer Function. Riparian buffers can improve water quality by slowing surface runoff, increasing infiltration, and trapping of sediment and nutrients (especially phosphorus [P]). Buffer vegetation may also influence shallow groundwater quality in low-lying areas where carbon (C) provided through rooting activity can enhance denitrification. The opportunity to influence shallow groundwater depends on the topography of the riparian zone, specifically the extent of low lying land adjacent to the stream, where roots of buffer vegetation can extend near the depth of shallow groundwater. The height above channel tool is used to map the extent of low-lying land in the ACPF riparian zones. Riparian catchments can be ranked by size to prioritize where buffer vegetation will intercept and filter the most runoff. Results of the height-above-channel tool can also be displayed to highlight areas where buffer vegetation can influence shallow groundwater. The ACPF includes a cross classification scheme, shown in simplified form in table 1, which can be used to identify how these two functional benefits of riparian buffer vegetation are distributed throughout a watershed's riparian zones (figure 3).
Summary of the riparian function assessment used to classify and map optimized buffer designs (simplified). Note these classes only refer to design of buffer vegetation. Adapted from Tomer et al. (2015).
Headwater catchments, which drain to stream initiation points, have little or no riparian zone available to establish buffer vegetation. This suggests planners should consider prioritizing edge-of-field practices in headwater catchments.
Saturated Buffer Opportunities. Saturated buffers comprise a water level control gate and a distribution pipe that are installed within the riparian zone; the gate is used to divert a portion of tile drainage from direct outfall, to be conveyed along the distribution pipe and discharged into riparian soils. Plant species in the riparian buffer should be tolerant of wet soil conditions. Properly designed and implemented, this practice raises the water table in the riparian zone to within 0.3 to 0.6 m (1 to 2 ft) of the surface, where soil C is available to effectively facilitate denitrification (Jaynes and Isenhart 2018). The saturated buffer placement tool in the ACPF identifies where riparian soils contain adequate C levels, and where discharged water is likely to raise the water table (rather than drain away quickly). The local topography is also important. If the site is too flat then adjacent crops may become inundated, or if it is too steep then seepage flows and soil erosion may occur within the buffer. Also, stream banks must not be so high that the risks of bank failure become significant. The saturated buffer tool in the ACPF allows users the discretion to adjust criteria on soil C, slopes, and bank height. The riparian catchments approach enables RAPS to display where saturated buffers may be suitable, and which of the riparian catchments found above these suitable sites will likely have a significant amount of tile drained cropland. The extent of tile drainage is often not known but can be estimated using queries within the ACPF. Utilizing the riparian catchments with RAPS, tile drainage sources and potential riparian sinks can be displayed simultaneously (figure 4). A multiwatershed comparison of saturated buffer placement opportunities (Tomer et al. 2020) provides further details.

Riparian buffer functional classes shown using Riparian Attribute Polygons (RAPs) placed along stream banks. The functional classes are determined by cross classifying size of riparian catchment with average width of zone where height-above-channel is <1.5 m (see table 1).

Estimated extent of tile-drained fields (hatched) for an example watershed, and riparian catchments where saturated riparian buffer installation may be feasible (yellow/brown). Watershed-wide, 53% of the riparian catchment areas that drain to riparian zones suited for saturated buffers are estimated to be tile drained. In the inset example, 24% of this riparian catchment is expected to be tile drained.
Mapping Concordance between Existing Conservation Implementations and ACPF Results. The ACPF provides a set of tools that can be used to develop a set of options, or a menu, of conservation practice placement options using a consistent approach. We found in evaluating a number of watersheds that many of the practices displayed in ACPF results have already been installed. The State of Iowa has set out to map existing conservation practice installations, including terraces, water and sediment control basins (WASCOBs), farm ponds, grassed waterways, and contour buffer strips, on a statewide basis (Iowa State University 2019). The extents of existing and ACPF-proposed placements of conservation practices can be compared in any Iowa watershed. This example watershed map (figure 5) shows that >90% of the ACPF-suggested practices for runoff interception have been installed in much of this watershed. However, there are riparian catchments with low concordance, <50%. Local conservation planners can prioritize landowner engagement through this type of assessment. Note that using the riparian catchments for display here avoids singling out individual fields/producers.

Concordance between the potential extent of runoff control practices estimated using the Agricultural Conservation Planning Framework and practices that are in place. There is >90% concordance for 59% of this watershed's riparian catchments.
Land Use–Based Riparian Prioritization. Understanding the spatial distributions of hydrologic flow paths in a watershed can provide critical information for assessing and prioritizing riparian management alternatives. In this example watershed (figure 6a), land use is dominantly for corn (Zea mays L.) and soybean (Glycine max [L.] Merr.) production, and there is no information to help define if or where edge-of-field and/or riparian practices should be prioritized. Here, we extend mapped information on cropping sequences to estimate average annual nitrogen (N) applications to cropland over a six year rotation. This does not require field-specific information; rather, we assume statewide averages of N fertilizer applications to different types of crops and their sequence (table 2) can be used to indicate how relative N applications may be distributed among riparian catchments in this watershed during a six year cropping sequence (figure 6b). If we then evaluate the results based on riparian catchments, we can develop a ranking of the watershed's riparian zones according to the amounts of N applied within each riparian catchment (figure 6c). Landowner engagement efforts and prioritization of practice placement options may then be better focused on locations more likely to influence water quality outcomes at the watershed outlet.
SUMMARY
The riparian catchments toolset in the ACPF is meant to bring a clearer visualization of landscape hydrology into the conservation planning process. Riparian buffers are a critical component of watershed conservation and there is a need to enable planners to bring riparian opportunities into watershed planning and landowner engagement. Use of riparian catchments can support a variety of approaches to prioritize riparian buffer placements in a precise way, considering upslope land use and conservation management options at a landscape scale. The applications provided here are just examples of the types of analyses enabled by discretizing a watershed into riparian catchments. Visualizations that help watershed landowners understand how water moves across their fields and where it flows toward local streams may encourage “watershed thinking” to better connect how conservation practices at key locations can help achieve local water quality outcomes/goals. An understanding of how different practices can be used in sequence (i.e., a “treatment train”) can be developed at the scale of specific landscapes. ACPF users are encouraged to explore alternative analyses using the riparian catchments approach.
Average annual nitrogen fertilizer application rates (kg ha−1) in Iowa for corn (Zea mays), soybean (Glycine max), small grains (spring wheat, Triticum aestivum), and pastures estimated during 2010 to 2015.
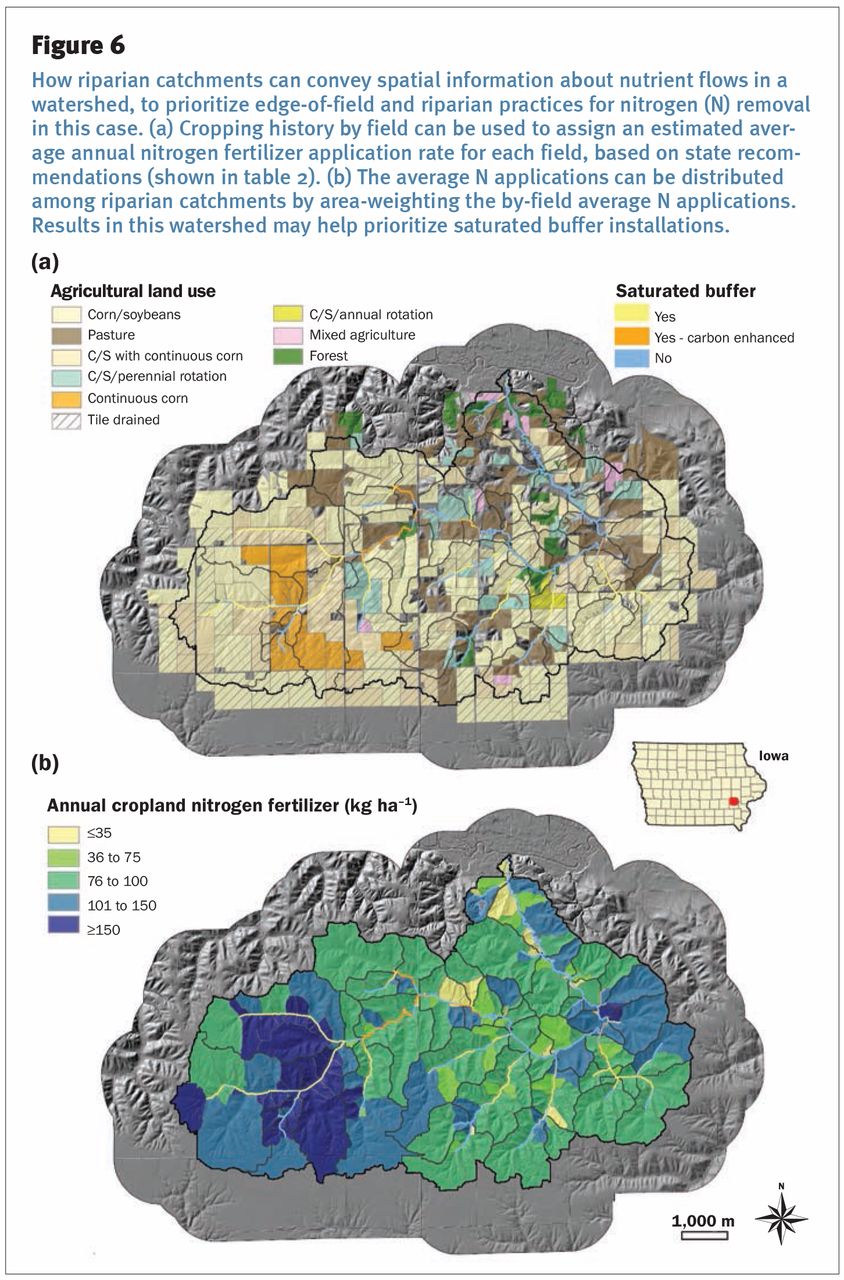
How riparian catchments can convey spatial information about nutrient flows in a watershed, to prioritize edge-of-field and riparian practices for nitrogen (N) removal in this case. (a) Cropping history by field can be used to assign an estimated average annual nitrogen fertilizer application rate for each field, based on state recommendations (shown in table 2). (b) The average N applications can be distributed among riparian catchments by area-weighting the by-field average N applications. Results in this watershed may help prioritize saturated buffer installations.
ACKNOWLEDGEMENTS
Development of the Agricultural Conservation Planning Framework was supported by a USDA interagency agreement between the Agricultural Research Service and the Natural Resources Conservation Service. USDA is an equal opportunity provider and employer.
Footnotes
DISCLAIMER
Mention of trade names or commercial products in this publication is solely for the purpose of providing specific information and does not imply recommendation or endorsement by the US Department of Agriculture (USDA).
- Received December 20, 2019.
- © 2020 by the Soil and Water Conservation Society
In this issue


Jump to section
Related Articles
Cited By...
- No citing articles found.