

Abstract
In the United States, Texas has one of the largest areas of land enrolled as well as expiring from the Conservation Reserve Program (CRP), and most of these restored grasslands are in the Southern High Plains region. Crop market forces and agency reductions in the number of hectares that can reenroll in CRP have resulted in many farmers considering recultivating this land. Converting grasslands to conventionally tilled annual croplands could reverse the accumulated benefits afforded from perennial grasslands. Three soil profile depths (0 to 10, 0 to 30, and 0 to 50 cm) from three long-term (>23 years) CRP and three converted CRP (C-CRP) sites were assessed annually from 2012 to 2015 (representing one to five years following conversion). Soil health indicators related to soil carbon (C) and nitrogen (N) dynamics were evaluated including soil organic C (SOC), total N (TN), particulate organic matter C and N (POM-C and POM-N), permanganate oxidizable C (POXC), microbial biomass C and N (MBC and MBN), in situ soil carbon dioxide (CO2) efflux, and metabolic quotient (qCO2). Redistribution of C following CRP conversion was detected in the MBC stock in 2012 with values higher in C-CRP than CRP at 0 to 30 cm and 0 to 50 cm profiles but not at 0 to 10 cm. The increase was short-lived with lower MBC in C-CRP than CRP in subsequent years. Most C and N stocks were lower in C-CRP compared to CRP across all depth profiles. The greatest losses of soil C and N stocks occurred at 0 to 10 cm, with the magnitude of loss varying by indicator and soil depth profile. Five years following conversion, SOC was reduced 2.7 Mg ha–1 at 0 to 10 cm, and averaged across all sample years, SOC was reduced by 4.3 Mg ha–1 at 0 to 50 cm. Drought stress was present from 2011 to 2014 and exerted an additional pressure to both systems, but the CRP system responded more positively to increased precipitation in 2014 and 2015. In CRP, the qCO2, an indicator of microbial stress, remained below 1.0 throughout the study, and MBC increased by 81% from 2012 to 2014, when drought stress was lessened. In contrast, MBC decreased and qCO2 doubled under C-CRP from 2012 to 2014. Overall, this study showed negative impacts on soil C and N stocks within five years after CRP to C-CRP conversion.
- Conservation Reserve Program
- labile soil carbon and nitrogen stocks
- metabolic quotient
- microbial biomass
- soil carbon dynamics and sequestration
Introduction
The Conservation Reserve Program (CRP), one of the largest private lands conservation programs in the United States, has enhanced multiple ecosystem services through conversion of highly erodible, marginal agricultural land to perennial vegetation. At the end of the CRP contract period, which is typically 10 to 15 years, most CRP land was reported to be reinstated for annual crop production (Bigelow et al. 2020). This land use conversion threatens to reverse many of the benefits realized during the conservation period. Since its establishment in 1985, the CRP has prevented billions of tonnes of soil from eroding (USDA FSA 2020), reduced nutrient loading and improved water quality (Cullum et al. 2010; Yin et al. 2021), restored wetlands and wildlife habitat (Marshall et al. 2008; Hellerstein 2017), and sequestered millions of tonnes of carbon (C) (Follet et al. 2001; Li et al. 2017). Additional soil health benefits documented include increased overall microbial activity as measured by respiration (Li et al. 2017), enzyme activities related to nutrient and C cycling (Acosta-Martinez et al. 2003), and microbial community composition shifts to more fungal dominant systems with reduced microbial physiological stress (Li et al. 2018).
Perennial grasses associated with CRP also play a critical role in sequestering atmospheric carbon dioxide (CO2) (Follet et al. 2001; Gebhart et al. 1994; Piñeiro et al. 2009). Following conversion of cropland to grassland or pastures, C sequestration rates have been shown to vary from 0 to 1,224 kg C ha–1 y–1 at 0 to 10 cm and 100 to 2,220 kg C ha–1 y–1 at 0 to 30 cm soil depth in cool temperate steppe ecosystems (Follett et al. 2001; Gebhart et al. 1994; Post and Kwon 2000) to 4,731 kg C ha–1 y–1 at 0 to 20 cm in frigid temperature and udic/aquic moisture regime in Minnesota (Follett et al. 2001). Specific to CRP soils within the Southern High Plains region, we previously reported C sequestration rates of 133 kg C ha–1 y–1 at the 0 to 30 cm depth on very sandy soils (Li et al. 2017).
Contracts for land enrolled in CRP are typically 10 to 15 years, with the possibility to reenroll at the end of the contract. At its peak, CRP supported 15 million hectares (M ha) devoted to conserving soil, water, and wildlife habitat. Due to federal budget restrictions, the size of the CRP program was reduced to 9.7 M ha in the 2014 Farm Bill with a slight increase to 10.9 M ha in the 2018 Farm Bill. In 2019 and 2020, 0.49 M ha and 1.22 M ha of land enrolled in CRP contracts expired, respectively. Some of this land might be reenrolled or placed under another conservation program (e.g., Environmental Quality Incentives Program or Conservation Stewardship Program) or converted back into crop production. Although leading the CRP program in terms of the area of enrollment (12.6% of total CRP) (USDA FSA 2019), Texas had 34,501 ha in 2019, 314,674 ha in 2020, and 223,925 ha in 2021 with expiring contracts, which contribute 8.7%, 17.5%, and 18.1% of the total national expiration levels, respectively (USDA FSA 2016).
Conversion of CRP grasslands back to annual row crops typically involves intensive soil disturbing practices, including the use of fire, grazing, and multiple tillage passes. Numerous studies have shown that these practices have reversed some of the ecosystem service benefits formerly established. For example, the post-CRP land management practices of grazing, haying, and crop production significantly increased soil runoff and erosion (Dao et al. 2000). Tillage and overwinter fallowing of former CRP in northern Mississippi increased erosion potential and decreased soil quality, including significant reductions in soil organic C (SOC) and total nitrogen (TN) (Gilley and Doran 1997; Gilley et al. 1997; Gilley et al. 2001). In eastern Washington, readily mineralized C decreased in the first year following conversion of CRP grassland to cropland with conventional tillage practices (Gewin et al. 1999). With the growing number of CRP contracts expiring in the Southern High Plains, it becomes more critical, environmentally, and economically, to understand how the conversion from CRP to cropland affects soil health to best guide agricultural management practices. Conversion of CRP to annual cropland in this region could result in rapid losses of SOC previously sequestered (Li et al. 2017) and negatively impact other soil health parameters in the fragile sandy soils common to the region (Cotton and Acosta-Martinez 2018). Understanding the short-term shifts of soil C and N following conversion may better inform farmers, researchers, and policymakers to design best management practices and programs that consider key ecosystem services, including SOC sequestration. As identified in a recent survey, soil organic matter (SOM) was one of the most common soil tests conducted and provided the most valuable information to farmers and researchers (Wade et al. 2021). Additionally, labile organic matter pools associated with soil microbes (e.g., microbial biomass), their C sources (e.g., particulate organic matter) and activities (e.g., respiration and the release of CO2) provide greater insights into the flow of C through the system and can be early indicators of C sequestration (Lehmann and Kleber 2015; Moore-Kucera et al. 2008).
The objective of this study was to evaluate changes in soil C and N dynamics during the first five years, across three soil depth profiles (0 to 10 cm, 0 to 30 cm, and 0 to 50 cm depth increments) following reinstatement of cropping land after at least 23 years under CRP (i.e., no agricultural production with land seeded to perennial grasses). We hypothesized that within one to two years following conversion back to annual dryland crop production, the more labile C and N pools (e.g., microbial biomass C and N [MBC and MBN], particulate organic matter C and N [POM-C and POM-N]) would be higher in converted fields relative to CRP resulting from the large input of fresh residues incorporated during discing and tillage events to prepare fields for planting. The flush of labile C, would be short-lived, however, given the warm climate and sandy nature of these soils. We expected that by the end of the 5-year study, labile C and N pools, as well as total SOC, would be depleted in converted CRP fields relative to neighboring CRP on the same soil type. Reporting values on an area basis and across different profile depths is important to ensure proper interpretation and management recommendations. Exploring C and N at different depth increments provides the opportunity to explore (1) the most fertile and active zone (upper 10 cm) where a large proportion of root biomass and soil C reside (Gill et al. 1999); (2) the effects of tillage and potential redistribution of resources in the converted systems since 0 to 30 cm and 0 to 50 cm depth profiles represent the layers of common shallow and deep tillage depths, respectively; and (3) the typical shortgrass root zone (top 50 cm soil) (Seastedt 1995).
Materials and Methods
Site Information and Experimental Design
The study area included a total of six fields across three counties in northwest Texas within the southern part of the Southern High Plains Major Land Resource Area as defined by the USDA Natural Resource Conservation Service (USDA NRCS 2006). The climate is semiarid, with an average annual temperature of 13°C to 17°C and an average annual precipitation range of 405 to 560 mm. The region is characterized by nearly level plains with deep, well-developed soils, with clay increasing in subsoil horizons and accumulations of calcium carbonate (CaCO3) . Dominant soil series within our sampling area included Amarillo and Patricia (fine-loamy, mixed, superactive, thermic Aridic Paleustalfs) and Arvana (fine-loamy, mixed, superactive, thermic Petrocalcic Paleustalfs) (Soil Survey Staff 1999). Collectively, these soils cover over 1.8 M ha across the Southern High Plains region (Soil Series Extent Explorer 2022). The three soil types are similar in nature with the A horizon approximately 30 cm deep, followed by a Bt horizon to 69 cm (Soil Survey Staff 2022). Soils are slightly alkaline with weak fine subangular blocky structure and the topsoil is brown (Amarillo and Arvana) or yellowish red (Patricia) in color. Amarillo typically has less organic matter and Patricia has slightly coarser surface horizons. A typical pedon of the Amarillo soil is characterized by an Ap horizon extending to 28 cm, followed by a Bt horizon from 28 to 69 cm. Depth to secondary carbonates occurs between 46 and 100 cm with a calcic horizon between 76 and 150 cm. A typical pedon of the Patricia series is very similar to the Amarillo with A1 horizon from 0 to 13 cm, A2 horizon from 13 to 30 cm, and a Bt1 from 30 to 69 cm. Secondary carbonates are much deeper in the Patricia soils, typically occurring between 100 to 203 cm with a petrocalcic horizon around 150 to 203 cm depth. Different from Amarillo and Patricia soils, Arvana soil has a petro-calcic horizon at 71 to 97 cm (Soil Survey Staff 1999). For all three soil types, the soil temperature regime is thermic, and the soil moisture regime is ustic bordering on aridic.
Three fields represented the converted CRP (C-CRP) sites and three were longterm (at least 23 years) CRP fields, which were used as baseline proxies. Sites were selected such that each county had a C-CRP field and CRP reference field within 8 km from each other and were located on similar soil type, initial CRP age, and similar seeding mixes during CRP establishment (table 1 and figure 1). Seeding mixes were dominated by warm season, perennial grasses including blue grama (Bouteloua gracilis) and sideoats grama (Bouteloua curtipendula) in CRP sites in Hockley and Terry counties and blue grama and yellow bluestem (Bothriochloa ischaemum) in Bailey County (Bugge 2013).

Map showing location of sampling sites within the three counties in the Southern High Plains of Texas. Within each county, one long-term (>23 years) Conservation Reserve Program site (CRP; blue points) and one dryland cropland converted from a similar long-term CRP site (C-CRP; green points) were sampled for a total of six sites (note that all points on map not visible due to scaling). Map on the left is an example of one of the counties showing the location of one CRP (green) and one C-CRP (blue) site. Within each site, three 100 m transects (white lines) were placed within the same soil series (e.g., within red outline of the Arvana soil series) and five soil cores were collected approximately every 20 m, split into three depths as shown, and homogenized. Thus, for each site, nine soil samples (three subreplicates from each of the transects × three depths) were collected and analyzed during each of the four sampling years (2012 to 2015).
Management history and soil information for each of the six sampling sites (Conservation Reserve Program [CRP] and converted CRP) across the three counties in the Southern High Plains.
The three C-CRP fields had been converted from grassland back to annual crop production within one to two years prior to initial sampling. Based on farmer interviews, conversion included the following practices: surface plant materials (growing plants and plant residues) were broken up one to two times by using a shallow-offset (<20 cm) disc harrow, followed by deep rip tillage (~50 cm) to loosen the soil surface. Beds were created (101 cm spacing) prior to planting. The C-CRP in Lamb/Hockley County was under CRP enrollment from 1997 to 2009 and, according to the landowner, was managed similarly to the CRP enrollment period from 1987 to 2012. In 2012, vegetation was cleared by cutting and baling the grass in March, prior to tillage, and the field was prepared for cotton (Gossypium hirsutum L.) planting as described above. In Bailey County, cotton was planted following contract expiration in 2012. In Terry County, the C-CRP was under CRP from 1987 to 2010 and was prepared for cotton production in 2011. All C-CRP fields were nonirrigated.
Soil Sample and Weather Data Collection
Soil samples were collected at 0 to 10 cm, 10 to 30 cm, and 30 to 50 cm using a tractor-mounted hydraulic soil sampling probe (diameter 5 cm) after harvest each November from 2012 to 2015 (figure 1). Within each field, three transects, 100 m in length and 100 m apart, were established to align with vegetative sampling in CRP sites in a parallel study (Bugge 2013). Sampling was conducted such that transects were positioned on nearly level land within the same soil map unit for each C-CRP and CRP county pair (e.g., see figure 1). Along each transect, five cores were collected at approximately 20 m distances along the transect, separated into the three depths, and hand-mixed to make a homogenized sample for each depth (i.e., composite of five core subsections). The nine homogenized samples for each field (three samples per depth) were transferred to the lab in an ice chest filled with icepacks. Samples were stored at 4°C and processed within 48 hours. A subset of each sample was sieved (<8 mm) and air-dried to determine soil POM. The rest of the samples were sieved (<4.75 mm) and analyzed for soil microbial properties at field moisture conditions or on air-dried soil for all other soil properties described below.
Precipitation, soil temperature, and soil diurnal temperature range (DTR, daily maximum temperature — daily minimum temperature) measured every 15 minutes from 2011 to 2015 were provided by the West Texas Mesonet Climate Center, Texas Tech University. The 5 cm and 20 cm depth data were selected to represent the averages of 0 to 10 and 10 to 30 cm, respectively. Weather data of each sampling field were calculated as the weighted average of three nearby weather stations (<70 km) based on their distance to the fields. Weather stations recorded information for both “bare soil” and “natural soil” with plant cover (named “vegetated soil” from this point forward). Due to the limited ground cover in the early growing season, the temperature and DTR from bare soil were used as proxies for the C-CRPs’ weather data. The weather data from vegetated soil were treated as proxies for the CRP fields’ weather data.
Soil Characterizations
Soil particle size was analyzed using the adapted pipette method (Gee and Bauder 1986) on air-dried 4.75 mm samples. Bulk density was calculated by dividing the stone-free, oven-dry weight of each soil core by volume. Soil POM was isolated using a size and density fractionation method (<1.85 g cm–3 and >53 μm) adapted from Crow et al. (2009) using air-dried samples through an 8 mm sieve. Soil organic C (SOC), TN, POM-C, and POM-N were analyzed using an Elemental Analyzer (Costech Analytical Technologies, Model 4010, Valencia, California) equipped with a zero-blank autosampler coupled to a Thermo-Finnigan (Bremen, Germany) Delta V Plus isotope ratio mass spectrometer as described in Li et al. (2017). Before analysis, acid-fumigation was performed on soil samples to remove inorganic C (Harris et al. 2001). Permanganate oxidizable C (POXC) was measured using the Weil et al. (2003) method, where soils were reacted with a 0.02 M potassium permanganate (KMnO4) solution and colorimetrically quantified by absorbance at 550 nm.
Soil MBC and MBN were measured using the chloroform fumigation-extraction method in duplicate on 15 g oven-dry equivalent field-moist soil samples and one nonfumigation control (Vance et al. 1987). Soil samples were fumigated with ethanol-free chloroform for 24 h in the dark at ambient temperature. Following fumigation, MBC was extracted by adding 75 ml of 0.5 M K2SO4 and shaking for one hour. Extractants were filtered and analyzed using a Shimadzu Model TOC/VCPH-TN C/N analyzer (Shimadzu, Kyoto, Japan). Soil MBC = FC/KEC, where FC is the organic C extracted from fumigated minus nonfumigated soil, and KEC is the extractable part of MBC after fumigation and estimated as 0.45 (Vance et al. 1987). Similarly, MBN = FN/ KEN, where FN is the organic N extracted from fumigated minus nonfumigated soil, and KEN is the efficiency of the extraction of organic microbial N from soil and estimated as 0.54 (Brookes et al. 1985). Results were expressed on a moisture-free basis by drying a subsample at 105°C for 48 hours.
Soil CO2 efflux was measured at six locations per field using a LI-8100A Soil CO2 Flux Survey System with a 20 cm chamber (LI-COR, Lincoln, Nebraska, United States) every month from November of 2012 to December of 2015. Due to instrument malfunctions, soil CO2 efflux data were not available from February to April of 2013. Collars (11 cm tall by 20 cm in diameter) were installed at the beginning of the study and remained in the field except during field preparation events in C-CRP. Collar replacement occurred only when damage was extensive enough to interfere with CO2 flux measurements. Collars were buried approximately 8 cm and placed to avoid low areas and plant bases. Soil temperature and volumetric water content were recorded in situ using a soil moisture probe (ECH2O EC-5 model, METER Environment, Inc., Pullman, Washington, United States) and a 20 cm soil temperature thermistor probe connected to the LI-8100A automated system. The cumulative soil CO2 efflux of each year was calculated by multiplying the average monthly CO2 efflux with the minutes during the month and then summing together with the earlier months of the year (Yang et al. 2019). To calculate soil metabolic quotient (soil respiration per unit microbial biomass, qCO2), the average of three soil CO2 efflux readings, taken one week prior to, the day of, and one week after soil sampling, were divided by the MBC (0 to 10 cm) on an area basis.
Statistical Analysis
All statistical analyses were conducted using R statistical software (R Core Team 2021). A mixed model analysis of covariance (ANCOVA) was conducted for all soil C and N stocks (SOC, TN, POM-C, POM-N, MBC, MBN, POXC) and qCO2 using lme function in nlme package (Pinheiro et al. 2018) to evaluate the impacts of CRP conversion across the three locations. The fixed factors were the system (C-CRP and CRP) and sampling year. The random factors were field transects (n = 3) nested within independent replicated locations (n = 3). For each depth profile there were a total of 72 observations (2 systems × 3 locations × 3 transects [nested within each location] × 4 sampling years).
The C and N stocks per ha (Mg ha–1) were calculated for each depth (0 to 10, 10 to 30, 30 to 50 cm) using the equation:
 1
1We focused on total soil C and N stocks across three depth profiles (0 to 10, 0 to 30, and 0 to 50 cm) by summing the appropriate individual depths. We recognize that individual depths may reveal different soil C and N stocks; however, our focus was to determine the overall effect of conversion on soil C and N dynamics across the three depth profiles. Reporting values on an area basis and across different profile depths are important to ensure proper interpretation and management recommendations. Although similar soil texture between each pair of CRP and
C-CRP fields was targeted during the site selection process, the soil clay+silt content was higher (p-value = 0.03) in all C-CRP than the nearby CRP (34.8% versus 30.0%). According to our previous study (Li et al. 2017), differences in soil particle distribution within the same textural class and soil series had a significant impact on soil C sequestration. Therefore, soil clay+silt content was evaluated as a covariate for each soil C and N stock.
The estimated marginal means (EMMs), also known as least-squared means, were calculated using emmeans and pairs functions in the emmeans package (Lenth 2021). The covariance from soil clay+silt was removed using cov.reduce argument. ANCOVA or ANOVA (when soil clay+silt% was not selected in the optimal model) and multiple comparisons with Tukey adjustment were conducted. Finally, the emmeans results were plotted using emmip function. Although the ANCOVA analysis was based on the EMMs, the raw means were provided in table S1 in the supplementary material. The 2015 MBC and qCO2 data were not reported due to instrument issues preventing reliable analysis for MBC this sampling year.
Repeated measure ANOVA was used to compare soil CO2 efflux and annual cumulative CO2 efflux over time with system and sampling time as fixed variables. Random variables included counties, sampling dates (two consecutive days to complete one month’s CO2 efflux reading: first day for CRP and the second day for C-CRP), and field replications.
Results and Discussion
Soil Carbon and Nitrogen Stock Dynamics at the Three Depths
Except for 2012, most stocks were lower in C-CRP than CRP, and at all depth profiles there was either a significant (alpha level of significance was set at 0.1) main effect of system or a system by year interaction (figures 2 and 3). When a significant interaction was present, differences between the systems were greater in 2014 and 2015 than in 2012 or 2013. At 0 to 10 cm, TN was 0.12 Mg ha–1 lower in C-CRP than CRP (figure 2d and table 2). There was a significant system by year interaction for all other C and N stocks (i.e., SOC, POM-C, POM-N, MBC, MBN, and POXC). SOC was greater in CRP than C-CRP in 2015 (figure 2a). Within C-CRP, SOC did not change significantly across the sampling years. In contrast, SOC in CRP increased each year from 2012 to 2015 and was significantly greater in 2015 compared to 2012 and 2013. By 2015, SOC in C-CRP was 2.7 Mg ha–1 lower than CRP (32.9% reduction). POM-C and POM-N followed similar patterns with greater stocks in CRP than C-CRP in 2013, 2014, and 2015 (figures 2g and 2j). POM stocks did not change between sampling years in C-CRP but were greatest in 2014 and lowest in 2012 for POM-C and POM-N.

Estimated marginal means for the Conservation Reserve Program system (CRP; blue triangles) and the converted CRP to annual cropped system (C-CRP; red circles) for (a to c) soil organic carbon (SOC), (d to f) total nitrogen (TN), (g to i) particulate organic carbon (POM-C), and (j to l) particulate organic matter nitrogen (POM-N) at soil depth profiles of (a, d, g, and j) 0 to 10 cm, (b, e, h, and k) 0 to 30 cm, and (c, f, i, and l) 0 to 50 cm from 2012 to 2015. Different capital letters indicate a significant difference between systems within the same sampling year. Different lowercase letters indicate a significant difference between sampling years within each system. Letters are only shown when there was a significant system by year interaction (α = 0.1). P-values from ANCOVA for main effect of system, year, and their interaction (Int.) are provided (n = 72 for each soil depth profile).

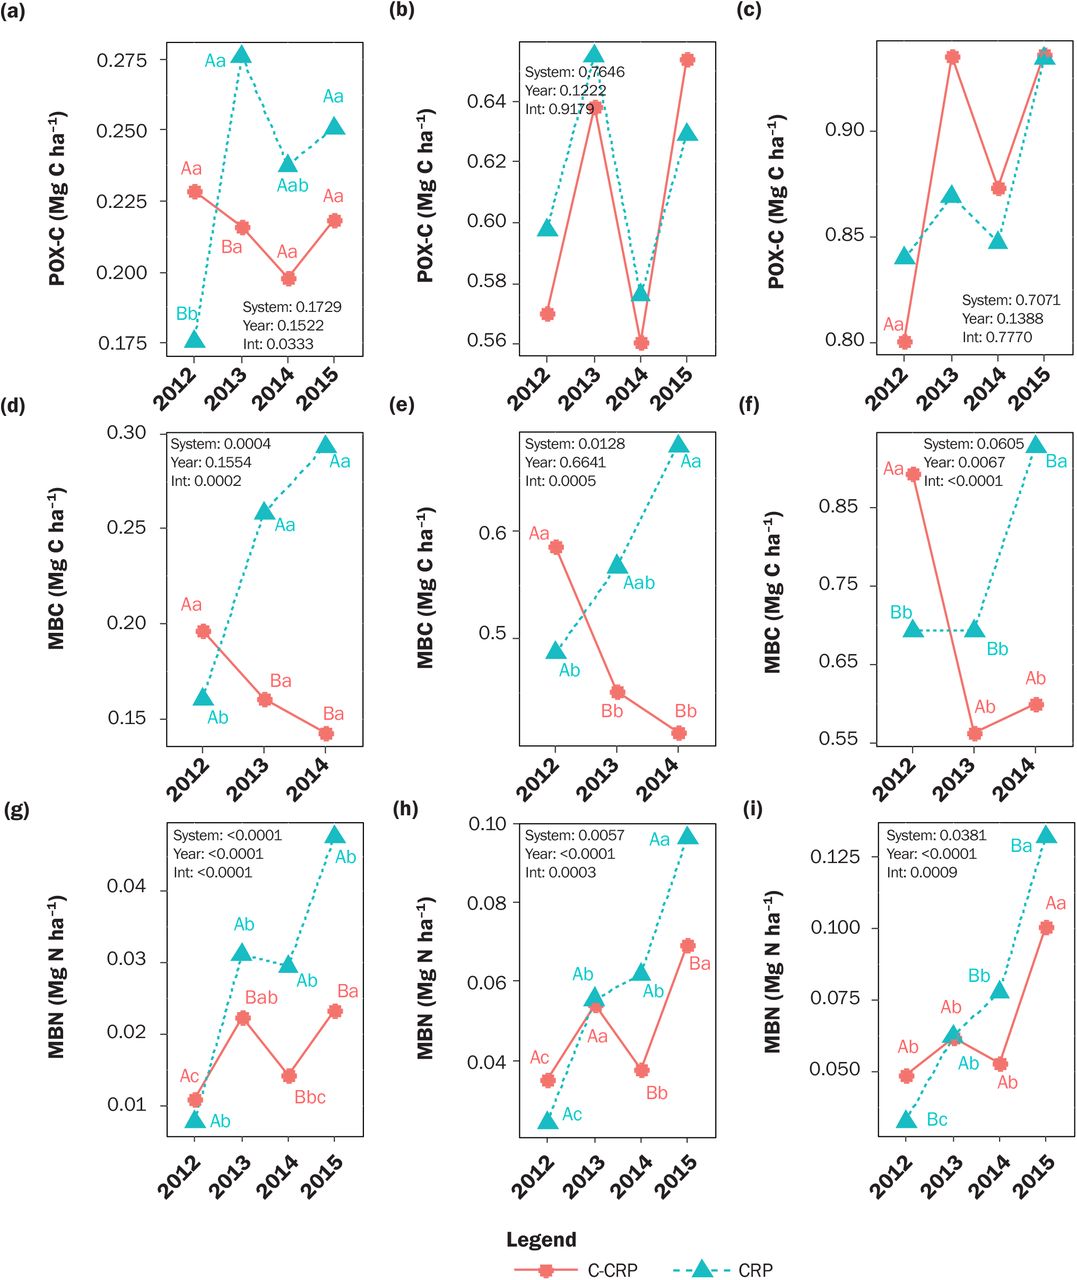
Estimated marginal means for the Conservation Reserve Program system (CRP; blue triangles) and the converted CRP to annual cropped system (C-CRP; red circles) for (a to c) permanganate oxidizable carbon (POXC), (d to f) microbial biomass carbon (MBC), and (g to i) microbial biomass nitrogen (MBN) at soil depth profiles of (a, d, and g) 0 to 10 cm, (b, e, and h) 0 to 30 cm, and (c, f, and i) 0 to 50 cm from 2012 to 2015. Different capital letters indicate a significant difference (α = 0.1) between systems within the same sampling year. Different lowercase letters indicate a significant difference between sampling years within each system. P-values from ANCOVA for main effect of system, year, and their interaction (Int.) are provided (n = 72 for each soil depth profile).
In 2012, MBC and MBN were statistically similar between C-CRP and CRP (figures 3d and 3g). In 2013 and 2014, soil MBC and MBN stocks were lower in C-CRP than CRP, and in 2015, MBN also was lower in C-CRP than in CRP. By 2014, MBC was 51% lower in C-CRP than CRP, and by 2015, MBN was 51% lower in C-CRP than in CRP. Within C-CRP, MBN was greater in 2013 than 2012 and in 2015 than in 2012 or 2014. Within CRP, MBC increased over time with significantly greater stocks in 2013 and 2014 compared to 2012. Soil MBN also increased over time and was significantly greater in 2015 than in 2012. C-CRP had greater POXC than CRP in 2012 and lower POXC in 2013 (figure 3a). Within CRP, POXC in 2013 and 2015 was greater than that in 2012 but did not change over time in C-CRP.
At 0 to 30 cm, there was a significant main effect of system for SOC (figure 2b) and POM-N (figure 2k), and a significant system by sampling year interaction for TN (figure 2e), MBC (figure 3e), and MBN (figure 3h). Averaged across sampling years, SOC was 1.40 Mg ha–1 lower and POM-N was 0.085 Mg ha–1 lower in C-CRP than CRP (table 2). In 2014 and 2015, C-CRP had lower TN than CRP. In 2012, MBC was 20% greater in C-CRP than CRP, and by 2014, MBC was 39% lower in C-CRP than CRP. Microbial biomass N was similar between C-CRP and CRP in 2012 and 2013. In 2014, MBN was 39% lower in C-CRP than CRP and in 2015 was 28% lower in C-CRP than CRP (figure 3h and table 2).
At 0 to 50 cm, there was a significant main effect of the system for SOC (figure 2c), POM-C (figure 2i), and POM-N (figure 2l), and a significant system by sampling year interaction for TN (figure 2f), MBC (figure 3f), and MBN (figure 3i). Averaged across sample years, SOC was 4.3 Mg ha–1 lower, POM-C was 0.59 Mg ha–1 lower, and POM-N was 0.116 Mg ha–1 lower in C-CRP than CRP (table 2). Stocks of MBC and MBN followed a similar pattern at this depth profile as described for the 0 to 30 cm profile (figures 3e, 3f, 3h, and 3i). By 2014, MBC was 35% lower in C-CRP compared to CRP, and by 2015, MBN was 24% lower in C-CRP compared to CRP.
Soil Micrometeorological Data and Soil Carbon Dioxide Efflux
Total precipitation increased from a low of 148 mm in 2011, the year prior to sampling, to a high of 597 mm in 2015 (average precipitation for the area is approximately ~450 mm) (figure 4a). Averaged over 2011 to 2015, soil temperatures were 1.17°C and 0.89°C higher in bare soil than vegetated soil in summer at 0 to 10 cm and 10 to 30 cm, respectively. Soil temperatures differed the greatest between bare and vegetated soil in the summer of 2015 when bare soil was 2.5°C and 1.4°C higher than vegetated soil at 0 to 10 cm and 10 to 30 cm, respectively (figure 4c). In winter, soil temperature in bare soil was 0.81°C and 0.73°C lower than vegetated soil at 0 to 10 cm and 10 to 30 cm, respectively. The DTR was higher in 0 to 10 cm than 10 to 30 cm for bare and vegetated soil each year, and the DTR of bare soil was greater than vegetated soil at both depths. The DTR in vegetated soil at 0 to 10 cm decreased from 2012 to 2015, which was not observed for bare soil (figure 4b).

Average weather conditions of the research sites from 2011 to 2015 from nearby weather stations. (a) Monthly precipitation, (b) average daily soil temperature, and (c) soil diurnal temperature range (DTR) under bare soil (proxy of C-CRP; red symbols) and vegetated soil (proxy of CRP; blue symbols) at 0 to 10 and 10 to 30 cm. In (a), the numbers before the slash represent the precipitation during the growing season from May to October of each year and the numbers after the slash represent the precipitation of the entire year.
There was a significant system by sampling time interaction for both monthly soil CO2 efflux (figure 5a) and cumulative CO2 efflux (figure 5b). Monthly soil CO2 efflux in both systems increased around June and declined around September each year (figure 5a). From 2013 to 2015, spikes in CO2 efflux (figure 5a) aligned with rainfall events during the spring and summer months (figure 4a). From 2012 to 2013, soil CO2 efflux was not different between systems until August of 2013, when C-CRP was greater than CRP (figure 5a) and the cumulative CO2 efflux was greater in C-CRP than CRP for the rest of 2013 (figure 5b). In 2014, there was no difference between systems until June when monthly soil CO2 efflux and cumulative CO2 efflux in C-CRP were greater than CRP. Monthly CO2 efflux in CRP increased in July but decreased in C-CRP. Consequently, CO2 efflux in C-CRP became less than CRP in July and October (figure 5a) and cumulative CO2 efflux greater in CRP than C-CRP from October to December (figure 5b). In 2015, soil CO2 efflux was greater in CRP than C-CRP from April to October (figure 5a) and cumulative CO2 efflux was greater in CRP than C-CRP from May to December (figure 5b).

(a) Average monthly soil carbon dioxide (CO2) efflux rate, (b) cumulative CO2 efflux, and (c) soil volumetric water content (n = 18 replicates for each system and year) for converted Conservation Reserve Program (C-CRP) and CRP. Different capital letters indicate a significant difference between systems within the same sampling month in plots A and B. Letters are only shown when there was a significant system and sampling year/month interaction (α = 0.1).
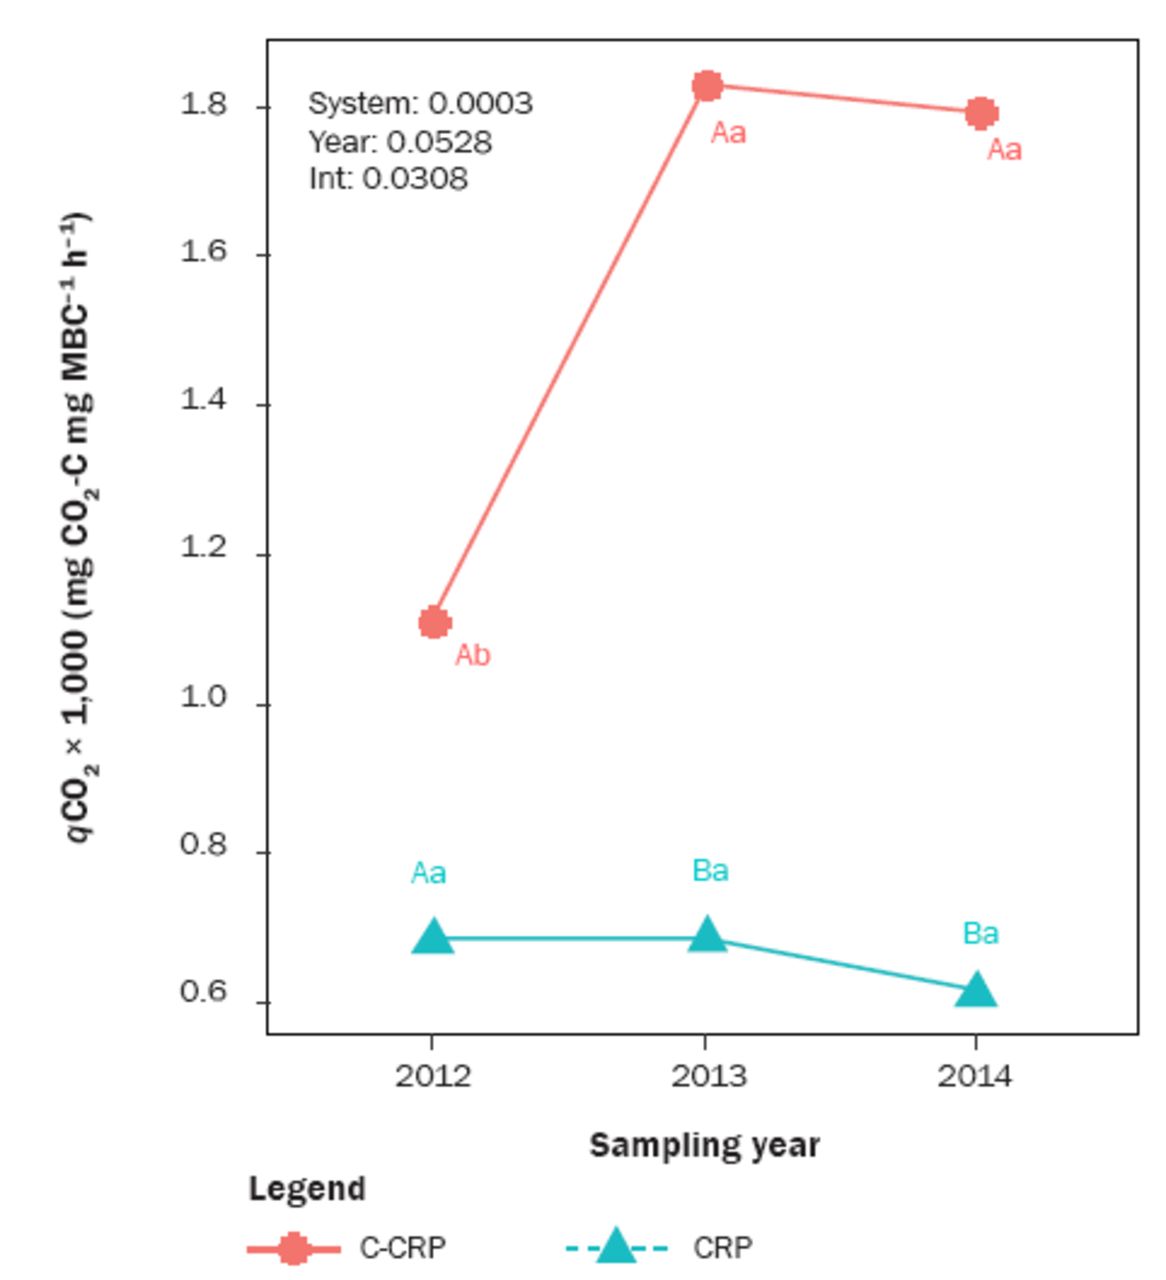
Average annual soil volumetric moisture content was 0.36%, 0.75%, and 2.54% higher in CRP than C-CRP in 2012 to 2013, 2014, and 2015, respectively (figure 5c). Annual cumulative soil CO2 efflux in C-CRP was 0.026 kg CO2-C m–2 higher than CRP in 2013 (figure 5b). The trend reversed in 2014 and 2015, and by 2015, CO2 efflux was 0.27 kg m–2 greater in CRP than C-CRP. Annual cumulative soil CO2 efflux in C-CRP was similar in 2014 (0.36 kg m–2) and 2015 (0.44 kg m–2) and in CRP nearly doubled between 2014 (0.42 kg m–2) and 2015 (0.71 kg m–2). Relative to 2012, the qCO2 in C-CRP was 0.71 mg CO2 -C mg–1 MBC h–1 greater in 2013 and 0.71 mg CO2-C mg–1 MBC h–1 greater in 2014 (figure 6). Soil qCO2 in CRP was constant from 2012 to 2014 (averaging 0.79 mg CO2-C mg–1 MBC h–1). There was no difference between systems in 2012. In 2013 and 2014, qCO2 was 111% and 126% greater in C-CRP than CRP.

Estimated marginal means of soil microbial metabolic quotient (qCO2) in the converted Conservation Reserve Program (C-CRP) and CRP systems. The capital letters indicate the difference between systems (CRP and C-CRP) within the same sampling year. The lowercase letters indicate the difference among different sampling years within each system (n = 72).
Soil Carbon and Nitrogen Pools Decreased following Conservation Reserve Program Conversion to Cropland
Soil organic matter is one of the most important soil quality/ health indicators because of its influence on numerous ecosystem functions (Lehman et al. 2015; Wander 2004). Our study provided a unique opportunity to track short-term changes important for C sequestration and N cycling through evaluation of multiple SOM pools following disturbance of longterm (>23 years) CRP sites at different depth profiles. We used the nearby, long-term CRP fields as proxies for baseline conditions to track changes in multiple soil C and N stocks following conversion of three CRP fields to row crop production over a four-year period (2012 to 2015). This sampling strategy enabled us to compare the converted fields over time and capture impacts from annual weather patterns previously shown to influence labile C and N pools (Pérez-Guzmán et al. 2020). In our study, although a significant system by year interaction was not present for SOC stocks at 0 to 30 or 0 to 50 cm, plotting SOC stocks by year reveals SOC stock changes were most pronounced following three to four years of conversion (i.e., 2014 and 2015 sampling years). No difference in SOC was detected at 0 to 10 cm until 2015. These results contrast with other studies that reported SOC declines within the first year following CRP conversion (Cotton and Acosta-Martinez 2018; Gilley and Doran 1997). In another study within the Southern High Plains region, MBC decreased 52% one month after converting CRP to cropland, and SOC decreased by 20% at 0 to 30 cm after one growing season (Cotton and Acosta-Martinez 2018). In a subtropical region, conversion of CRP to cropland in northern Mississippi caused a 28% reduction in SOC, 57% reduction in MBC, 70% decrease in MBN, and a 78% decline in mineralizable N in 0 to 30.5 cm within nine months (Gilley et al. 1997).
Organic residue decomposition and SOM formation is continuously processed by the decomposer community (microbes) from large plant residues (POM) toward smaller molecules (Lehmann and Kleber 2015). Our study documented a 26% loss of SOC and 19% TN within the first five years of conversion with a substantial amount of the reduction attributed to losses of POM-C and POM-N in the top 10 cm. Soil POM-C, POXC, and MBC represent three stages of C as residues are decomposed and transformed to SOM and CO2. During decomposition, POM-C is formed along with the release of POXC and both forms can be assimilated into MBC. In our study, these more labile C and N pools were sensitive to the disturbances following conversion to cropland, reflecting the dynamic flow of C and N, and thus nutrient cycling and energy exchange (Bongiorno et al. 2019). The POXC pool reflects several simple C substrates (e.g., carbohydrates, amino acids, amine/amide sugars, and C-compounds containing hydroxyl ketone, carboxyl, double-bound linkages, and aliphatic compounds) (Blair et al. 1995; Loginow et al. 1987) that are readily available to soil microbes (Weil et al. 2003). When a pulse of resources is added to the system, such as those released following incorporation of grasses through tillage and discing in preparation for crop production, microbes rapidly metabolize the released C compounds, producing new microbial biomass and increasing respiration to support growth (Schimel and Weintraub 2003).
Tillage redistributes plant residues and SOM from the surface to lower depths (Franzluebbers 2002; Moreno et al. 2006; Kay and VandenBygaart 2002; López-Fando and Pardo 2011). Based on these studies, SOC was expected to be greater in C-CRP at depth than CRP. However, in our study, SOC was consistently greater in CRP versus C-CRP at 0 to 10 and 30 to 50 cm with no differences detected at 0 to 30 cm (data not shown) and when summed across these depths. Our results, therefore, did not show a redistribution and increase of C in the tilled C-CRP system at depth or across the deeper profile (i.e., 0 to 50 cm). Likely the contribution of perennial vegetation with more active roots throughout the year coupled with the lack of tillage disturbance in the CRP system were key drivers of the greater SOC observed there than in C-CRP, regardless of depth. The MBC pool, however, was responsive to organic residue redistribution and rapid release of C as MBC increased in 2012 in the C-CRP compared to CRP in the two deeper soil profiles (0 to 30 and 0 to 50 cm) but not in the surface profile (0 to 10 cm). The increase in MBC in C-CRP was short-lived, and by 2013 (0 to 10 cm) and 2014 (all soil depth profiles), MBC was lower in C-CRP than CRP. Furthermore, CRP stored higher proportion of C at the surface than C-CRP, reflecting relatively undisturbed soil with enhanced soil health in the surface that supports other functions such as improved water infiltration via increased macropore development for rapid water transmission into the soil profile, more stable aggregates, an abundant supply of organically bound slow-release nutrients, and a diverse food supply for beneficial soil organism activities (Franzluebbers 2002).
Soil Carbon Transformations Differed between the Two Systems in Response to Shifts in Soil Moisture, Temperature, and Microbial Interactions
The Southern High Plains region is prone to extreme drought and temperatures, which can have a negative impact on the soil microbial community, potential enzymatic activities, and SOM storage (Acosta-Martinez et al. 2010, 2014; Pérez-Guzmán et al. 2020). In our study, the conversion from CRP to cropland occurred during an extreme drought that began in 2011, and although precipitation increased each year from 2011 to 2015, much of the region remained under drought conditions until 2015 (Pérez-Guzmán et al. 2020). Plant productivity typically increases with increasing precipitation, which would translate to increased MBC, soil CO2 efflux, and other labile soil C pools. In our study, more positive surface responses to increased precipitation were detected in the perennial CRP systems than annual row crop C-CRP system: (1) MBC and POXC increased in CRP, whereas MBC and POXC remained constant in C-CRP; (2) MBN had a greater increase in CRP than C-CRP; (3) microbial metabolic stress indicator, qCO2, increased in C-CRP but no change in CRP; and (4) the divergence in cumulative CO2 flux between systems started earlier in CRP than C-CRP, was more pronounced in 2015 compared to 2014, and tracked with greater soil moisture.
Most of the differences between the systems and over time likely are the result of the perennial CRP system’s capacity to recover from the environmental stress of drought more efficiently and quickly than C-CRP row crop systems. Moreover, the C-CRP is not irrigated and the drought conditions of 2012 and 2013 resulted in partial or total crop failure (personal communication with farmers involved in the study). The disturbances from converting the perennial grassland system to row crop production coupled with multiple years of drought created intense environmental pressures for the C-CRP system. This “stress” was reflected in the two-fold qCO2 increase in C-CRP from 2012 to 2013 that persisted in 2014. In contrast, the qCO2 in CRP remained below 1.0 and was not significantly different between sampling years.
The production of microbial biomass is governed largely by microbial physiological traits such as microbial C use efficiency (CUE, the proportion of new biomass synthesized from anabolism of substrate-C). Carbon use efficiency affects the rate and efficiency of conversion of plant-produced C to microbial products (Sinsabaugh et al. 2013) and thus potentially on the rates of SOC accumulation (Bradford et al. 2013) since the majority of the soil C pool is microbial-derived (i.e., dead microbial necromass) (Cotrufo et al. 2013). Microbial CUE is also sensitive to the soil environment (i.e., soil moisture) and resource availability (Zheng et al. 2019). Furthermore, management practices that alter microbial assemblages to ones with high CUE and subsequently facilitate a more efficient conversion of plant inputs to microbial biomass, may enhance stable SOC accumulation (Lee and Schmidt 2014; Lehmann and Kleber 2015). The continuous and rapid turnover of living microbial biomass can produce, over time, a considerable amount of necromass (Liang et al. 2011), now considered an essential constituent of stable SOM (Cotrufo et al. 2013; Kallenbach et al. 2015, 2016; Schmidt et al. 2011). In general, MBC and SOC tended to increase and qCO2 remained stable over the four-year study in CRP, supporting the potential for greater SOC sequestration in these perennial systems. Between 2012 and 2015, EMMs for SOC in CRP increased 2.84, 4.55, and 11.8 Mg C ha–1 at 0 to 10 cm, 0 to 30 cm, and 0 to 50 cm, respectively. The incremental increase of SOC with each increasing total depth profile reflects the contributions of root turnover and root exudates to the soil system. Given the rapid increase in SOC at all depth profiles following increased precipitation in 2014 and 2015, it is unclear whether this SOC will be persistent or be further decomposed and lost as CO2 with more time. The dynamic nature of SOC at depth in these perennial systems in this short time frame suggests these systems are resilient to environmental stresses but fragile when physically disturbed. However, they are fragile in that accrued SOC can rapidly be lost with physical disturbances such as those imparted with the conversion of perennial grasslands to dryland row crops. Relative to these physically disturbed cropland systems with minimal C return to the system (e.g., no cover crops established and minimal crop residues from cotton plants), the soils in the perennial CRP system, which experiences minimal/no physical disturbances, were resilient to the environmental stress of multiple drought years, as they respond quickly and efficiently to precipitation in 2014 and 2015.
Increased precipitation and warm temperatures in spring and summer months stimulates plant growth, root exudation, microbial growth, and residue decomposition. In CRP, the warm season C4 perennial grasses break dormancy around February or March when soil temperatures exceed 10°C (Sharpe and Rayburn 2019). Thus, the entire CRP system is activated before the cropped systems since cotton is not planted until early to mid-May (Warrick et al. 2002). In the cotton system, spring conditions activate residue decomposition without new C additions from plant growth until later in the season.
Soil organic C accumulates when C additions exceed losses, and in part depends upon the dynamics of the microbial community. Soil priming is a term used to describe the stimulated decomposition of old C when new C is added and can be grouped into “apparent” and “real” priming processes. Apparent priming corresponds to a change in the CO2 evolved from microbial biomass turnover after the input of easy-available substrates (Bastida et al. 2019; Blagodatskaya and Kuzyakov 2008). Both CRP and C-CRP in 2015 likely experienced an apparent priming since CO2 flux dramatically increased. When the quantity and quality of residues rapidly decreases with decomposition and can no longer support the microbial population, the priming effect of SOM mineralization is triggered and is called “real priming” (Blagodatsky et al. 2010; Kuzyakov 2010). When the flow of organic C sources is in balance with the metabolic demand of the microbial community, the stability of organic C in deep soil layers is maintained. However, any change in land use and agricultural practice that increases the distribution of fresh C along the soil depth profile could stimulate the loss of buried stable soil C (Fontaine et al. 2007).
As soil microbes become more active in the spring with warmer temperatures, decomposition of plant residues ensues. In CRP, current residues as well as new root exudates translated to high CO2 flux, high MBC, activity, turnover, and low qCO2 with an overall accumulation of SOC by 2015. In contrast, the C-CRP was subjected to repeated soil disturbances from tillage, discing, and mixing of cotton or sorghum (Sorghum bicolor L.) residues. Without adequate additions of new C sources, SOC flows in C-CRP were disrupted and ultimately resulted in decreased SOC in C-CRP relative to CRP across the 0 to 30 and 0 to 50 cm profiles. Increased SOC across the deeper profiles from 2012 to 2015, especially in CRP, reflect the dynamic nature of SOC in these sandy soils and the importance of root C exudation and microbial turnover in driving SOC storage. The perennial, deep rooted plants in CRP were able to support the microbial community and contributed to increased SOC relative to crop production inputs and buried organic matter during field conversion in C-CRP. From 2012 to 2014, the MBC:SOC ratio in C-CRP declined, whereas it remained constant or slightly increased in CRP (data not shown). These results, coupled with the qCO2 data suggest that conversion from CRP to C-CRP increased the “real priming” effect and negatively impacted SOC storage capacity in SOC.
Summary and Conclusions
Within five years following conversion of CRP to cropland SOC, POM-C, POM-N, MBC, and MBN were reduced compared to the long-term CRP fields, and the C-CRP system was less resilient to recover from a natural drought event. Among the variables tested, soil MBC and MBN were the most sensitive indicators that captured transformations of soil C at the two deeper profiles across the sampling years. Evaluating the response of the soil C and N pools at the three different depth profiles was valuable to assess the effects of management conversion on the entire profile and accounted for the impacts of C redistribution and possible protection at depth with tillage practices. Future studies should aim to collect samples prior to any conversion to track field-specific responses over time to help account for differences in soil (e.g., even small changes in clay content) and environmental (e.g., local soil moisture and temperature) conditions. In our study, declining trends persisted at 0 to 30 cm and 0 to 50 cm, suggesting that conversion of CRP to dryland annual cotton/sorghum production negatively affected C and N stocks. Compared to grasslands, annual cropping systems, such as cotton and sorghum, use practices that potentially lead to losses of soil C and N including multiple tillage passes, removal of C inputs through harvesting, and lack of deep-rooted, perennial vegetation that encourages C sequestration. Given the sandy soil texture, inherently low SOC, high erodibility, and interannual weather variability, we encourage landowners with expiring CRP contracts in the Southern High Plains to maintain perennial grasses in these systems. This could be achieved through reenrollment in CRP or other conservation programs, such as Environmental Quality Incentives Program or Conservation Stewardship Program. If conversion to agricultural production is necessary, systems could be converted to grazing lands with practices such as prescribed grazing and improved range plantings. Finally, if annual row crop production is chosen, conservation management practices such as no-till, diversified crop rotations with high residue-returning crops or perennials, cover crops, and integration of livestock are strategies that can help maintain the ecological benefits previously realized from the perennial CRP systems.
Supplemental Material
The supplementary material for this article is available in the online journal at https://doi.org/10.2489/jswc.jswc.2022.00141.
Acknowledgements
This material is based upon work that is supported by the USDA National Institute of Food and Agriculture, under award number 2012-67019-30183. The authors gratefully acknowledge Jon Cotton (biological science technician) and other lab members from Veronica Acosta-Martinez’s lab for assistance with soil sampling and lab analyses, Ian Scott-Fleming (staff researcher for Texas Tech University Climate Science Center) for providing environmental data from the West Texas Mesonet climate science center, USDA Natural Resources Conservation Service staff for information on the Conservation Reserve Program and croplands, and the landowners for their collaboration and coordination in collecting the data.
Footnotes
Disclaimer
Mention of trade names or company names in this publication is solely for the purpose of providing specific information and does not imply recommendation or endorsement by the University of Missouri or the USDA Agricultural Research Service.
- Received September 15, 2021.
- Revision received December 16, 2021.
- Accepted December 21, 2021.
- © 2022 by the Soil and Water Conservation Society
References
In this issue


Jump to section
Related Articles
Cited By...
- No citing articles found.