

Abstract
Cover crops promote environmental health and agricultural production, but most research in the Midwest focuses solely on winter cereal rye (Secale cereal L.) (CR). We evaluated cover crop mixtures compared to single species in terms of cover crop biomass (n = 32 site-years), cash crop yield (n = 32), and subsurface water quality (n = 17) spanning six sites and seven years in Iowa. Before soybeans (Glycine max [L.] Merr), the single species was CR and the mixture species were CR, radish (Raphanus sativus), and rapeseed (Brassica napus). Before corn (Zea mays L.), the single species was oats (Avena sativa) and the mixture species were oats, radish, and hairy vetch (Vicia villosa). Before soybeans, average fall growth of CR in the single species was significantly greater than or similar to the mixture. Fall growth before corn with oats was significantly less than or similar to the oat mixture. Before soybeans/during soybean growth, both cover crop treatments had significantly lower spring nitrate-nitrogen (NO3-N) concentrations in soil pore water than the control, and single species had lower concentrations than mixtures. Even with mostly winterkill cover crops before corn, spring NO3-N concentrations of soil pore water were significantly lower in the single species treatment than in the no cover treatment. Cover crop treatments had no influence on corn yield overall and slight negative influence on soybean yield at two of the sites. We propose the following to increase diversity of cover crops in the Midwest: CR before soybeans, oats and/or an oat mixture before corn, and introducing brassicas and hairy vetch in southern Iowa. In this project, these diverse species were possible after broadcast seeding in late August, and that would be our planting recommendation to promote fall growth.
Introduction
Farmland in the Upper Midwest benefits from subsurface or “tile” drainage to optimize crop production (Skaggs et al. 1994; Van Schilfgaarde 1987). This tile, especially when paired with annual crops and rich organic soils (Helmers et al. 2012), can act as a conduit for water-soluble nitrate-nitrogen (NO3-N), which has led to water quality issues locally (Coppess 2016; Eller 2015) and nationally (Rabalais and Turner 2019). In Iowa, cover crops are promoted as a water quality improvement tool because they scavenge for excess N in the soil profile (Dinnes et al. 2002; Thapa et al. 2018a; Wagger and Mengel 1988) but have also been promoted for their soil health and agronomic improvements (Blanco-Canqui et al. 2015).
Single species cover crops have been shown to increase soil organic matter resulting in improved soil physical properties such as infiltration, soil structure, and reduced compaction (Basche and DeLonge 2019; Clark 2008; Villamil et al. 2006; Weil and Williams 2004). In a meta-analysis and modeling study, Nichols et al. (2020) reported that grass cover crops reduced weed biomass. Finney et al. (2016) showed that several of these ecosystem services increase as the cover crop biomass increases. The total area in corn (Zea mays L.) and soybean (Glycine max [L.] Merr) rotation in Iowa is an estimated 9.3 million ha (USDA NASS 2021). According to the 2017 USDA Agricultural Census, there are only 0.4 million cover crop ha in Iowa. Barriers to adopting conservation practices such as cover crops include crop insurance, lack of renter incentive, confidence in the efficacy of nutrient retention, and risk of cash crop yield reductions (Carlisle 2016; Fleckenstein et al. 2020; Gardezi and Arbuckle 2019; Ranjan et al. 2019).
Iowa Learning Farms (2019) estimated via their field day surveys that 87% of cover crop hectares in Iowa planted winter cereal rye (Secale cereal L.). Winter cereal rye (CR) is a popular cover crop because it is winter-hardy, germinates easily, and grows quickly and vigorously in both wet and dry conditions (Appelgate et al. 2017; Clark 2008; Singer 2008). There are mixed responses of corn yield with CR, but soybean yield is more stable (Dabney et al. 2010; Marcillo and Miguez 2017; Ruffo et al. 2004; Waring et al. 2020). The causes of decreased corn yield include diseases, N deficiency, and poor stand (Acharya et al. 2018; Bakker et al. 2016; Clark et al. 1994). We hypothesize these concerns could be alleviated by diversifying cover crops beyond a grass to include winterkill species, an N-fixing legume, or brassicas with lower carbon (C) to N ratios. Increasing the number of species can increase biomass production due to increased complementarity; having more than one species increases the odds resources such as water and nutrients will be used regardless of the weather extremes (Wilke and Snapp 2008). However, in Iowa, there is such a narrow growing season that less winter-hardy options may not be viable.
Additionally, while a lower range of C/N ratios is less likely to immobilize N for the following cash crop, it may pose a risk to water quality, especially in winterkill species because of increased decomposition rates and nutrient release (Wagger and Mengel 1988). Brassicas are a popular winterkill species with large taproots and are known to alleviate compaction better than grasses (Clark 2008). Hairy vetch (Vicia villosa) is a legume crop that depletes minimal moisture (Wilke and Snapp 2008), has the potential to supply N to the following crop, and has been researched extensively outside of the Midwest (Thapa et al. 2018b). To our knowledge there are no studies investigating the water quality impacts of hairy vetch in Iowa. Oats (Avena sativa) are low-cost, reliable, and could pair well even as grass with corn because they winterkill (Clark 2008).
It is hard to maintain the delicate timing of providing inorganic soluble N to cash crops while also immobilizing N when necessary, and N transformations depend on many factors beyond management, including climate, weather, microbial properties, and organic matter (Clark et al. 2019; Drinkwater and Snapp 2007; Finney et al. 2015; Gentry et al. 2009; Iqbal et al. 2018; Mahal et al. 2019). Drinkwater and Snapp (2007) posit a paradigm should shift to re-couple nutrient cycles via reservoirs in soil for slower cycling of nutrients. Cover crops improve N cycling and retention (Blanco-Canqui et al. 2015). Diversifying inputs, for example, through cover crops, can increase soluble C (Clark et al. 1998), the reservoir of N in the soil (Drinkwater et al. 1995), or increase labile soil organic matter pools, which can lead to a net increase in N mineralization (Castellano et al. 2019). These internal processes are controlled in part by soil aggregate formation, which can be measured relatively easily.
This research aims to give more options to farmers in Iowa while addressing some of these barriers via measurements in yield response, nutrient retention, and aggregate formation. We evaluated the growth of single species versus mixtures and their effects on corn and soybean yield, water quality, and various soil properties.
Materials and Methods
Site Characteristics and Experimental Design. There were three treatments in this study, which began with cover crop seeding in the fall of 2013: mixture (M), single (S), and a control of no cover crop (NC). Before 2014, all crops were in a corn–soybean rotation. Each treatment was replicated four times at six research locations in Iowa for varying degrees of time at each research site, ranging from the crop years 2014 to 2020 and totaling 32 site-years (figure 1a). Soil properties of each site are listed in table 1. Each plot was in a corn/soybean rotation with C and SB present each year, for a total of 24 plots each (figure 1b and 1c). All cover crop treatments were broadcast seeded at 2.5 × 10⁶ seeds ha−1 into the standing crop in late August or early September. All treatments had the same seeding densities, which Wortman et al. (2012) referenced as the substitutive approach, to avoid any confounding effect when comparing monocultures and mixtures (e.g., higher seeding rate in the mixture).
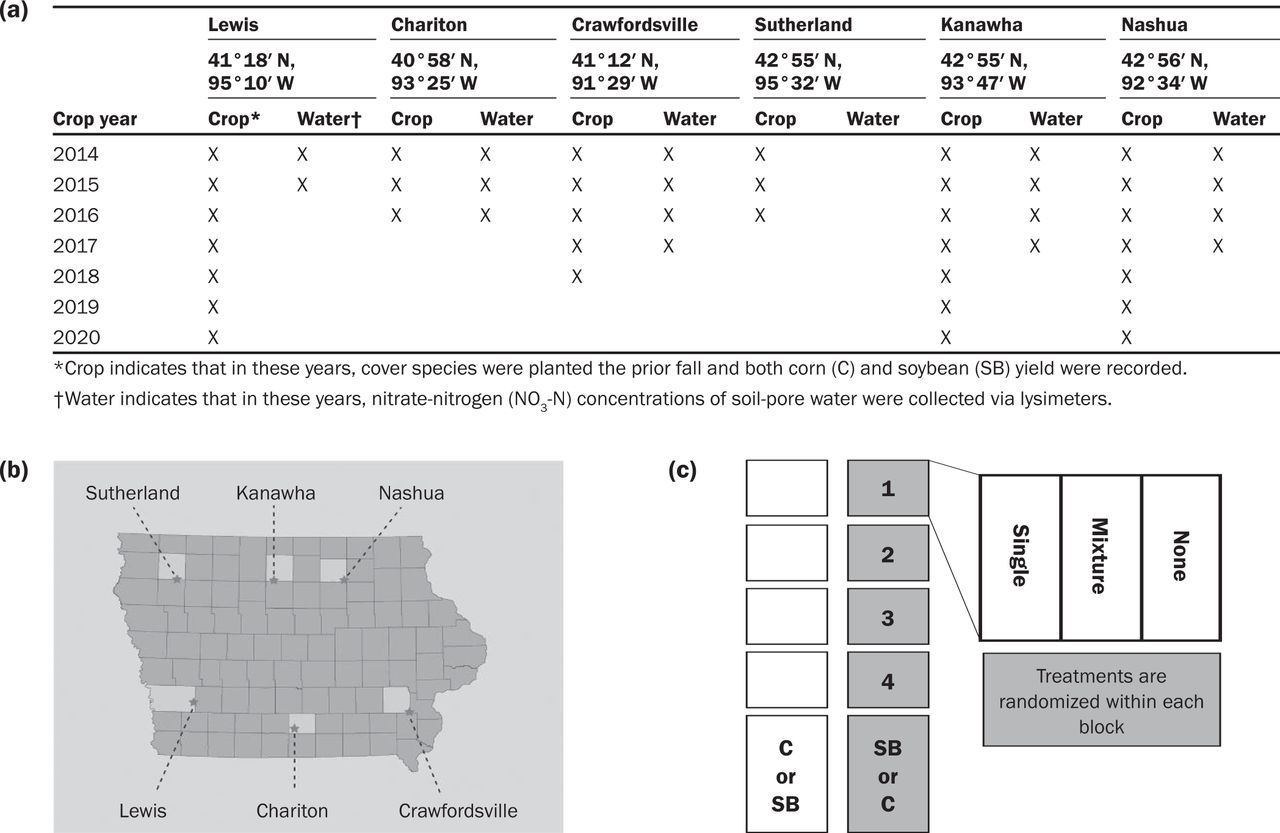
Site locations and experimental design.
Weather and soil properties for each research farm.
Before corn, the single species was oats, here-in called Oats-S, and seeded at 75 kg ha−1 or 2.5 × 10⁶ seeds ha−1. The mixture species were oats (58 kg ha−1 or 1.9 × 10⁶ seeds ha−1), hairy vetch (11 kg ha−1 or 0.3 × 10⁶ seeds ha−1), and radish (Raphanus sativus) (5 kg ha−1 or 0.3 × 10⁶ seeds ha−1) and is here-in referenced as Oats-M. Before soybean, the single species, CR-S, was Elbon CR (75 kg ha−1 or 2.5 × 10⁶ seeds ha−1), and the mixture species (CR-M) were CR (36 kg ha−1 or 1.2 × 10⁶ seeds ha−1), radish (nitro) (4 kg ha−1 or 0.2 × 10⁶ seeds ha−1), and rapeseed (Brassica napus) (3 kg ha−1 or 1.1 × 10⁶ seeds ha−1). The single species seeding rates are within the range recommended for Iowa within the Whole Farm Conservation Best Practices Manual (Conservation Learning Group 2020).
All plots for a given year and site had the same source and rate of N applied. Crawfordsville and Nashua applied 168, Lewis applied 196, and Chariton applied 200 kg N ha−1 of 32% UAN. Kanawha applied between 141 and 183 kg N ha−1 of 32% UAN, and Sutherland applied 150 kg N ha−1 of 28% UAN. Plots were 15.25 m long and ranged from 4.6 m to 9.1 m or 6 to 12 rows wide. All sites were under no-tillage, and each site had the same randomized complete block design with four replications, blocked by area and randomized within each block (figure 1c). Planting, harvest, and termination dates for cash and cover crops for all farms are reported in supplemental tables S1, S2 and S3.
Sample Collection and Processing. We analyzed treatment effect on total fall biomass (TFB), fall C uptake, fall N uptake, and fall C/N ratio. The same variables were tested in the spring: total spring biomass (TSB), spring C uptake, spring N uptake, and spring C/N ratio. TFB and TSB samples were clipped at the ground to include only the aboveground biomass each fall around the hard freeze and in the spring around termination. A quadrat was thrown in three random places to represent the whole plot. Between 0.18% and 3% of the total treatment surface area was sampled by the quadrat. Plant samples were separated by species, dried at 40°C, weighed, and tested for total C (TC) and total N (TN). Nutrient uptake for the mixture treatments was calculated by multiplying the percentage by the dry weight and summing the total for all species present. For determining seasonal C/N ratio, the total C uptake of all species was divided by the total N uptake of all species. Grain yield was harvested via combine by research farm personnel, and corn yields are reported at 15.5% moisture and soybean yield at 13%.
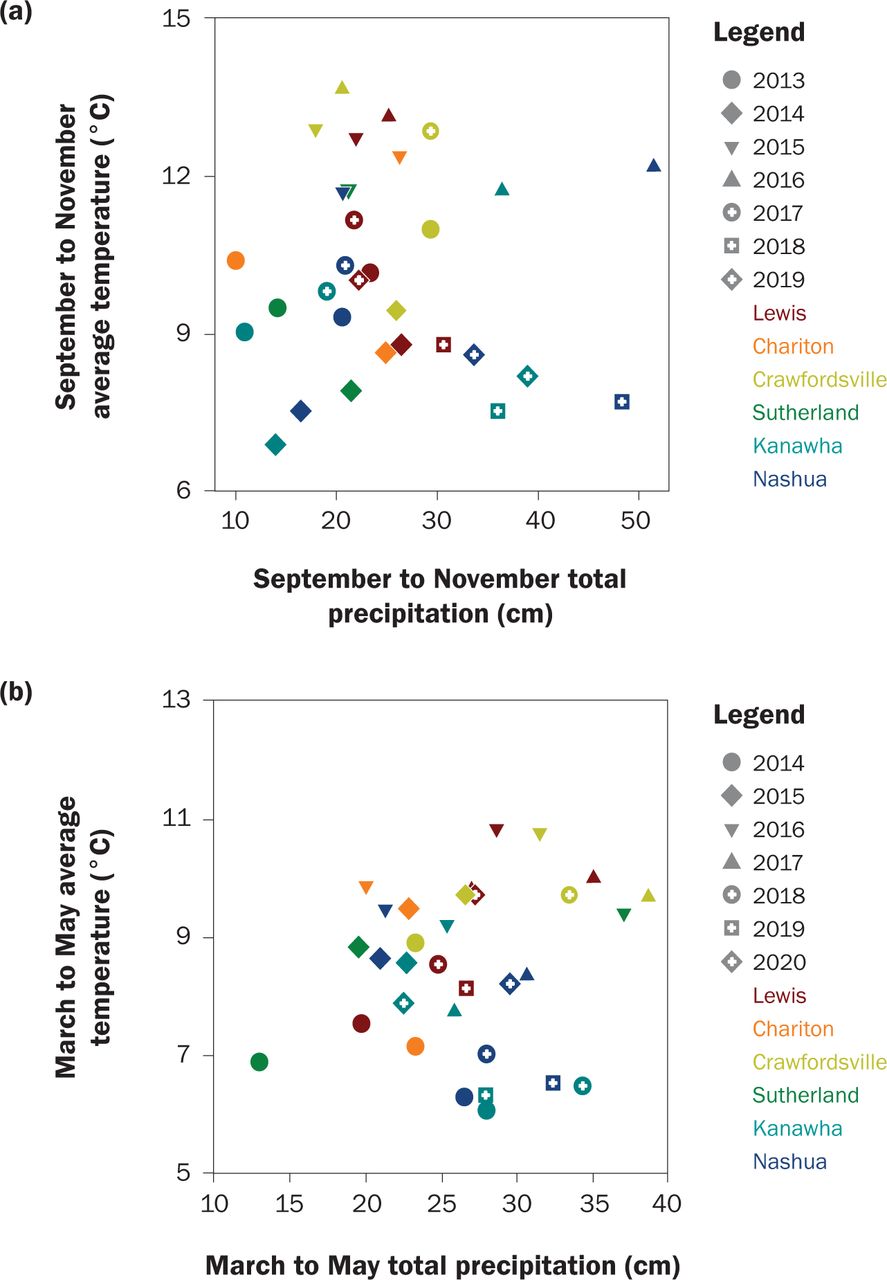
Soil pore water was collected via suction lysimeters with one lysimeter installed 0.61 m deep, to represent the primary crop root zone, in the center of each plot. Water samples were collected every two weeks from April to November and tested for NO3-N concentration via the second-derivative spectroscopy in the Wetland Research Laboratory at Iowa State University (Crumpton et al. 1992). They were transported immediately to a cooler kept at 4ºC and filtered prior to analysis. Samples were typically tested within three months of collection. Precipitation and temperature data were downloaded from the National Climate Data Center (Menne et al. 2012). The southern stations from west to east were Guthrie Center (USC001333509), Chariton (USC00131394), and Crawfordsville (USC00121873). The northern stations from west to east were Cherokee (USC00131442), Mason City (USW00014940), and Charles City (USC00131402). Weather during the study and site normal are shown in figure 2 and table 1.

Weather during (a) fall and (b) spring cover crop growth. Precipitation and temperature were downloaded from National Climate Data Center.
We collected soil samples using a 4.4 cm diameter probe at depths 0 to 10 cm and 10 to 20 cm at four sites (Kanawha, Nashua, Lewis, and Crawfordsville) in fall of 2018. The wider diameter allowed aggregates to remain intact and be tested for wet-aggregate size distribution via the Yoder (1936) method. We used 100 g of air-dry soil, wet the soil up to field capacity, and spread the soil evenly on a stack of three sieves with openings of 2 mm, 1 mm, and 0.21 mm. The soil was placed in water and soaked for 5 minutes, and then oscillated up and down at 30 strokes per minute for 10 minutes. The sand fraction was determined for each aggregate size and subtracted out from the total aggregate weight, as they are not considered aggregates. These details are described in Nimmo and Perkins (2002). We kept the remaining portion of the soil sample to be tested for total organic C and total N via combustion using a LECO TruMac at Ward Laboratories in Kearney, Nebraska. Mean weighted diameter (MWD) was calculated to quantify aggregate stability (Van Bavel 1950).
Statistical Analysis. Treatment differences were detected using PROC GLIMMIX, a generalized linear mixed model, from SAS Institute Inc. (2013). For all crop and cover crop variables, treatment, location, and treatment × location were considered fixed effects, and year and replication (nested within year and location) were considered random. For the analysis of MWD, treatment and location and their interactions were considered fixed, and replication (nested within location) was considered random. Corn and soybean phases were analyzed separately for everything except for MWD. We compared total N, total C, C/N, and percentage growth across species. For this analysis, species (Sp) and location (L) were fixed effects and the year was random. When there was not enough sample to collect due to inadequate growth or winterkill, TFB was assumed to be 0.001 kg ha−1. When there was no spring growth, TSB was assumed to be 0 kg ha−1. When the cover crop was too small to get TC and TN, they were considered to be 0 kg ha−1. Our C/N ratios are likely skewed high because the value for the younger plants that were collected but not tested would be extremely low.
Water quality data were aggregated by season where spring is April, May, and June; summer is July and August; and fall is September, October, and November. Spring represents after-winterkill, and it is how Dale et al. (2008) define spring in the Gulf Hypoxia Action Plan. Fall represents the period of cover crop growth. For corn, that cover crop is CR (and mixture) planted into standing corn, and for soybeans the cover crop is oats (and mixture) planted into standing soybeans. Annual NO3-N concentrations were analyzed using water year from October 1 to September 30. The soybean water year begins with standing or just-harvested corn and CR (and mixture) growing, goes through soybean planting and growth, and will have approximately 30 days of oats (and mixture) growing until September 30. The corn water year is the opposite and begins with standing or just-harvested soybeans and oats (and mixture growing), goes through corn planting and growth, and has approximately 30 days of CR (and mixture) growth until September 30.
Annual means have the main effects of treatment, location, season, and their interactions. Seasonal means have treatment, location, and their interactions. All water quality data were analyzed using a covariate of soil organic N to a depth of 20 cm taken at the beginning of the study to account for plot-to-plot variability and to improve our ability to detect statistical differences. Water year was considered a random effect, thus not a repeated measure. We hypothesized that NO3-N concentration would be influenced most by a given year’s weather patterns and not by the number of years the treatment had been in place.
We did a pairwise comparison t-test to analyze growth, C and N contents, and C/N ratio between cover crop treatments in each site-year within cash crop and season. To evaluate the benefits of seeding multiple species and how their performance compared to one another, we analyzed the percentage of species seed-wise (number of seeds in a given species divided by the total number of seeds) to percentage of species growth-wise (aboveground growth of a species divided by total aboveground biomass weight). Percentages were transformed using arcsine, and NO3-N concentration was log-transformed to achieve normality before using GLIMMIX to detect differences. Lysimeter values can be incredibly variable because of their dependence on rapidly changing soil pore water. Additionally, there was only one lysimeter in each plot. Thus, we used a p-value of 0.1 to detect statistical differences for water quality. For all other variables, we used a p-value of 0.05.
Results and Discussion
Treatment Effect on Fall Cover Crop Biomass. Treatment had a significant effect on TFB ahead of soybeans (p = 0.01), where CR-S produced more biomass than CR-M (CR, radish, and rapeseed) (table 2). Study average TFB for CR-S was 183 kg ha−1, ranging from 0 to 853 kg ha−1 at a given site-year (figure 3a). Study average TFB for CR-M was 156 kg ha−1, ranging from 0 to 1,081 kg ha−1 (figure 3a). Ahead of corn, there was no significant difference in TFB for Oats-S (oats) and Oats-M (oats, radish, and hairy vetch). TFB averaged 298 kg ha−1 (ranging from 0 to 1,380 kg ha−1) for Oats-S and 320.5 kg ha−1 for Oats-M (ranging from 0 to 1,861 kg ha−1) (figure 3b).
Results of analysis of variance for cover crops and cash crops. Fixed effects are treatment (trt), location, and their interaction.

Fall growth at cover crop mixtures sites. A star indicates there was a difference between treatments for that site-year. Left to right the panels are: Lewis, Chariton, Crawfordsville, Sutherland, Kanawha, and Nashua. Graph (a) is ahead of soybeans, (b) is ahead of corn.
Kaspar et al. (2012) reported an average of >600 kg ha−1 of growth for oats as a fall cover crop in central Iowa over five years, but they seeded at 3.7 × 10⁶ seeds ha−1 compared to our 2.5 × 10⁶ seeds ha−1. Appelgate et al. (2017) studied cover crop species in Iowa and seeded CR at 67 kg ha−1, and a CR-vetch mixture at 45 and 11 kg ha−1, respectively. They planted immediately after soybean harvest and had fall growth of 62 kg ha−1 or less for both CR and CR-vetch mixture over five site-years, with no benefit from the mixture. Also in Appelgate et al. (2017) a monoculture hairy vetch was planted at 17 kg ha−1 (compared to our seeding 11 kg ha−1), and their average study growth was 5 kg ha−1, where ours was 38 kg ha−1. Appelgate et al. (2017) planted two rapeseed varieties at 6 kg ha−1, whose average fall growth was 12.5 kg ha−1. Ahead of soybean, we seeded at 3 kg ha−1 of rapeseed and 4 kg ha−1 of radish. The two brassicas were often hard to distinguish and yielded an average total brassica of 62.2 kg ha−1. Ahead of corn, radish averaged 27.8 kg ha−1 yield at a seeding rate of 5 kg ha−1.
The growth of all species was better in our study compared to Appelgate et al. (2017), likely due to earlier planting and more site-years providing opportunities for better weather. Kaspar et al. (2012) seeded CR at the same rate as our experiment, but reported an average TFB of 1,300 kg ha−1, which is greater than even the most growth in our study. One key difference is they planted CR after both soybeans and corn, and the years after soybeans yielded more due to more N availability and timely rainfall in those particular years.
In the fall, there were four out of 32 site-years where the CR yielded greater than its mixture, and one time where the mixtures treatment yielded more (figure 3a). The most likely explanation for the single species treatment yielding more than mixtures treatment is that it had a higher seeding rate of CR known for being winter-hardy and for its ability to grow in a variety of conditions Clark (2008). The mixtures treatment only out-grew the single species treatment during an exceptionally warm fall of 2016 at Lewis, and that was the most growth of radish in the entire study by both weight (639.4 kg ha−1 versus average 59.1 kg ha−1) and percentage (60.0% versus average 25.8%) ahead of soybeans.
In the fall ahead of corn, there were only two cases where the treatments were different, and both times the oats mixture yielded more than oats alone (figure 3b). In one instance, at Crawfordsville in 2014, only hairy vetch germinated and produced a total of 20.5 kg ha−1 and no other species germinated that fall or the following spring. That fall had the coldest temperatures of the study at that site, especially in September, but precipitation was adequate compared to normal (figure 2 and table 1). The other instance was at Crawfordsville in fall of 2016 with the greatest radish growth in the study with 592.6 kg ha−1 (compared to the study average of 71.9 kg ha−1), and it made up 31.8% (compared to study average of 16.2%) of growth. That fall was exceptionally warm with normal precipitation.
In other words, the mixtures outperformed the single species during two extreme temperature years ahead of corn, but only at one site. In a study in Pennsylvania, Finney et al. (2016) determined the average biomass in mixtures was higher than monocultures but cautioned that this is not evidence of complementarity. In a meta-analysis, Cardinale et al. (2011) state that they are highly confident that a mixture will not out-grow its most highly productive species. Another experiment in Pennsylvania found that grasses generally outperform, and brassicas underperform compared to their mixture (Murrell et al. 2017). Wortman et al. (2012) compared cover crop mixtures ranging from two to eight species to sole crops of brassica and legumes in Nebraska, and mixtures out-produced compared to legume monoculture but not compared to brassica (mustard) monoculture. They found that increasing diversity did not increase primary biomass production. In general, we report that in the fall, CR (a grass species) outperformed its grass-brassica mixture, and oats (a grass) yielded the same as its grass-brassica-legume mixture.
Treatment Effect on Spring Cover Crop Biomass. There was a treatment effect on TSB in both soybeans (p < 0.0001) and corn (p = 0.0031) (table 2). CR-S TSB averaged 1,735 kg ha−1, where CR-M yielded an average of 1,274 kg ha−1 (figure 4a). Our growth was similar to Kaspar et al. (2012) in central Iowa, who reported an average of 1,810 kg ha−1 before soybeans, but they seeded much later in the fall. Spring growth for CR-S ranged from 0 (n = 8 out of 128) to 7,530 kg ha−1, and CR-M from 0 (n = 18 out of 128) to 6,230 kg ha−1. Appelgate et al. (2017) had similar termination timing and seeding rates but reported average growth of 758 kg ha−1 in CR monocultures and mixtures, half the growth of this study, likely due to later fall planting compared to our study. Another Iowa study that included southern, central, and northern Iowa locations reported 990 kg ha−1 average yield for CR over eight site-years, and they drill-seeded at 70 kg ha−1 after harvest (Pantoja et al. 2016).

Spring growth at cover crop mixtures sites. A star indicates there was a difference between treatments for that site-year. Left to right the panels are: Lewis, Chariton, Crawfordsville, Sutherland, Kanawha, and Nashua. Graph (a) is ahead of soybeans, (b) is ahead of corn.
The strong effect of CR treatments in the spring was due to the higher seeding rate of the winter-surviving species in the single treatment. In the spring, the instances where there was no growth ahead of soybeans all occurred in 2014, following the lack of germination in fall of 2013. However, the single species treatment had growth at four out of six sites, where mixtures had growth at one out of six sites that particular year. One explanation for the increased survival in the single species plots is that there were a greater number of CR seeds, increasing the chance of germination this particular spring. However, because this was the first year of the study, there could have been treatment carryover influencing moisture, nutrients, or herbicide presence.
Ahead of corn, the strong treatment effect where Oats-M was much greater than Oats-S in the spring was expected because the only species hypothesized to overwinter consistently (hairy vetch) was present only in the mixture treatment. On a few occasions, oats survived over the winter due to delayed germination. Oats-S averaged 5.8 kg ha−1 and Oats-M averaged 53.4 kg ha−1 for total growth (figure 4b). Hairy vetch survived 5 out of 32 site-years. The greatest growth was 570 kg ha−1 occurring two years in a row at Lewis. Poffenbarger et al. (2015) evaluated CR and vetch as monocultures and mixtures and had much greater spring growth with an average of 5,920 kg ha−1 with hairy vetch and 10,950 kg ha−1 with CR. They seeded their monocultures at almost 3× our rates with hairy vetch at 34 kg ha−1 and CR at 167 kg ha−1 and were in a less harsh winter hardiness zone in Pennsylvania (USDA ARS 2021). There were similar yet more pronounced trends in the spring compared to the fall: CR monoculture outgrew its mixture due to higher seeding rates, and the oats mixture ahead of corn outgrew its monoculture.
Carbon and Nitrogen Content and Carbon/Nitrogen Ratio by Treatment. Total fall C uptake followed the same pattern as aboveground biomass where CR was greater than its mixture and oats were not different from its mixture (table 2). Average fall C uptake was 80.4 kg ha−1 for CR and 64.3 kg ha−1 for the CR mixture (p = 0.0027) (data not shown). Ahead of corn across treatments, the average C uptake was 129.2 kg ha−1. Fall N uptake was not different with treatment and was 7.3 kg ha−1 before soybeans and 10.7 kg ha−1 before corn. Ahead of soybeans, the fall C/N ratio was significantly lower (p < 0.0001) in the mixtures with 9.9, compared to single with 10.7. Ahead of corn, the fall C/N ratio did not differ with treatments and averaged 13.1, despite having a brassica and a legume in the mixture. CR monoculture had a greater (p < 0.001) total spring C uptake, N uptake, and C/N ratio of 741 kg ha−1, 37 kg ha−1, and 18.7 compared to the CR mixture values of 539 kg ha−1, 29 kg ha−1, and 15.4.
Performance of Species. In the CR mixture, seed-wise percentages were 48% for CR and 52% for brassicas (9% for radish and 43% for rapeseed). The growth-wise percentages were 68% for CR and 39% for brassicas. Thus CR, on average, was more valuable per seed. However, when radish could be separated from rapeseed, it made up an impressive 29% growth-wise. Ahead of corn, seed-wise oats made up 78%, radish 4%, and hairy vetch 12%. Growth-wise, oats were 71% of the total, radish 21%, and hairy vetch 15%. Radish again displayed that it may be worth planting based on its seed number to growth ratio, which may be due to its increased edge in competition for light and water because of its erect growth and large canopy leaves compared to legumes being low growing (Tremmel and Bazzaz 1993). It has been noted that with brassicas, a lower density is better to avoid competition among the brassicas for light (Szumigalski and Van Acker 2008). Legume, surprisingly, had a greater fall C/N ratio of 13.1 compared to the grass at 11.8, which was significantly greater than brassica at 10.1.
Comparing the type of cover crop planted ahead of soybeans, brassica had the greatest N content of 4.4%, significantly greater than CR in the mixture (4.3%), and both were greater than monoculture CR of 4.1%. Brassica ahead of soybeans had the lowest C content of 38% and was significantly lower than CR at 43%. C/N ratios were different for all types of cover crops, with brassica at 9.1, CR mixture at 10.3, and CR single species at 10.7.
Ahead of corn, N content was greater in radish (3.8%) than oats and hairy vetch, which were both 3.5% (table 3). Hairy vetch had the greatest C content (44%), which was significantly greater than oats at 43%, and both were significantly greater than radish at 39.2% (table 3). Radish had the lowest C/N ratio at 11.2, which was significantly lower than all three other species at 13.1 (table 3). In the spring, the legume C/N ratio was 9.6, which was significantly less than grass at 17.6. Because the C/N ratio of hairy vetch is decreasing by spring, combined with the research from Choi and Daimon (2008) and Anugroho et al. (2009) that it begins fixing its own N at around 11 C/N, we hypothesize that hairy vetch had gotten big enough that it was fixing its own N. Assuming 50% N recovery in corn as found by Varco et al. (1989), this would be approximately 13 kg ha−1 N credit during the two years of 570 kg ha−1 spring growth.
Mean total carbon (TC) or total nitrogen (TN) percentage and C/N ratio by species and location. Values within the same site and variable that have the same letter are not statistically different at the 0.05 probability level.
Weather Effects on Cover Crop Growth. There was no fall growth in any treatment, crop, or site in fall of 2013, the first year of the study. This was likely due to very low precipitation that fall (figure 2), but herbicide or treatment carryover cannot be ruled out because it was the first year of the study. Wilson et al. (2013) state the best indicator of successful CR establishment was precipitation within one week of aerial seeding. There was no precipitation at any site within at least 10 days of seeding in 2013, except for 0.3 cm at Sutherland. Hairy vetch can survive over winter up to hardiness zone 3, and chances are improved with snow cover, cultivation, or pairing with hardy grass (Clark 2008; USDA ARS 2021). Clark (2008) states hairy vetch is particularly sensitive to frozen temperatures below 15°C. The two years (2018 and 2019) that produced substantial hairy vetch growth (>570 kg ha−1) at Lewis can partly be explained by weather: in winter of 2018, most days with a low below −15°C were accompanied with snow cover, and before spring of 2019 the first day with a low <−15.5°C was not until January 25, 2019.
Location Effects on Cover Crop Growth. The location had a strong significant effect (p < 0.0009) on TFB and TSB in both corn and soybean (table 2). There was an interaction between treatment and location only in spring cover crop growth in corn (table 2). This is because there was spring growth only at some locations and only some years.
We hypothesized that the three southern sites would have better growth due to warmer temperatures. We tested this hypothesis of latitude using contrast statements between the northern and southern sites for each species. There was no effect of latitude on TFB, fall C uptake, or fall N uptake. However, latitude did impact the fall growth of individual species, such as brassicas. On average when separated, the southern sites yielded 38.9 kg ha−1, or 82% more radish than the northern sites (p = 0.0042), and rapeseed produced 14.7 kg ha−1 or 162% more in the southern sites (p = 0.0124). The two highest site-year averages for radish were Crawfordsville in fall of 2016 ahead of corn (590 kg ha−1 or 32% of the mixture) and Lewis in fall of 2016 ahead of soybeans (640 kg ha−1 or 65%). Those were the only two site-years with radish growth >200 kg ha−1, and they were both in the south.
Total N content was lower in the north (4.0% compared to 4.3% where p = 0.0002). Total C content was lower in the south (41% compared to 42.4%, p = 0.0003). Fall C/N was significantly greater in the northern sites with 12.7 compared to 10.5 in the south due to composition differences: in the southern three sites, grasses (CR and oats) made up 60.9% of the mixture, wherein the northern three sites, grasses made up 78.6% of the mixture (p < 0.0001). Brassicas made up 36.9% of the mixture in the south and 22.7% in the north (p < 0.0001). Legumes (vetch) composed 24% of the corn mixture in the south and 6% in the north (p < 0.0001).
Latitude influenced TSB ahead of soybeans (1,121 kg ha−1 versus 2,850 kg ha−1) and spring N uptake (26.3 kg ha−1 versus 39.4 kg ha−1), and both were significantly (p < 0.0002) greater in the northern sites, even though their termination dates were similar (tables S2 and S3). The greater growth in the northern sites could be from a higher percentage of grass in the fall. There is also evidence that CR in the north was more mature in the fall. Fall CR C/N was greater in the north (11.2 versus 9.9, p < 0.0001) and spring CR C/N was also greater in the north (19.0 versus 15.8, p = 0.0062). Thus, the greater biomass and C/N contents are likely due to both a greater percentage of CR seeds and more mature (bigger) CR in the northern sites. There was no effect of latitude on C content; however, N content was 3.0% in the south and 2.5% in the north (p < 0.0001).
Treatment Effect on Water Quality. Not surprisingly, CR was very effective at reducing NO3-N concentration. Soybean water year NO3-N concentrations for all available site-years (17) were 4.3 mg L−1 in the NC treatment, which was greater (p = 0.0001) than the mixture (CR-M) with 2.8 mg L−1, and both were significantly greater than CR-S at 1.5 mg L−1 (p < 0.0001). It should be noted that there was very little or no growth in 2014, yet these values are still included in the statistical analyses and figures. The effect of treatment differed with location (tables 4 and 5). Annual NO3-N concentration with CR-S was significantly less than no NC at all sites but Lewis, where CR-S was equivalent to NC (tables 4 and 5 and figures 5b, 5c, 5d, and 5e).
Lysimeter nitrate-nitrogen (N) concentration (mg L−1) by season.
Analysis of variance p-values for lysimeter nitrate-nitrogen (N) concentration (mg L−1) by season.
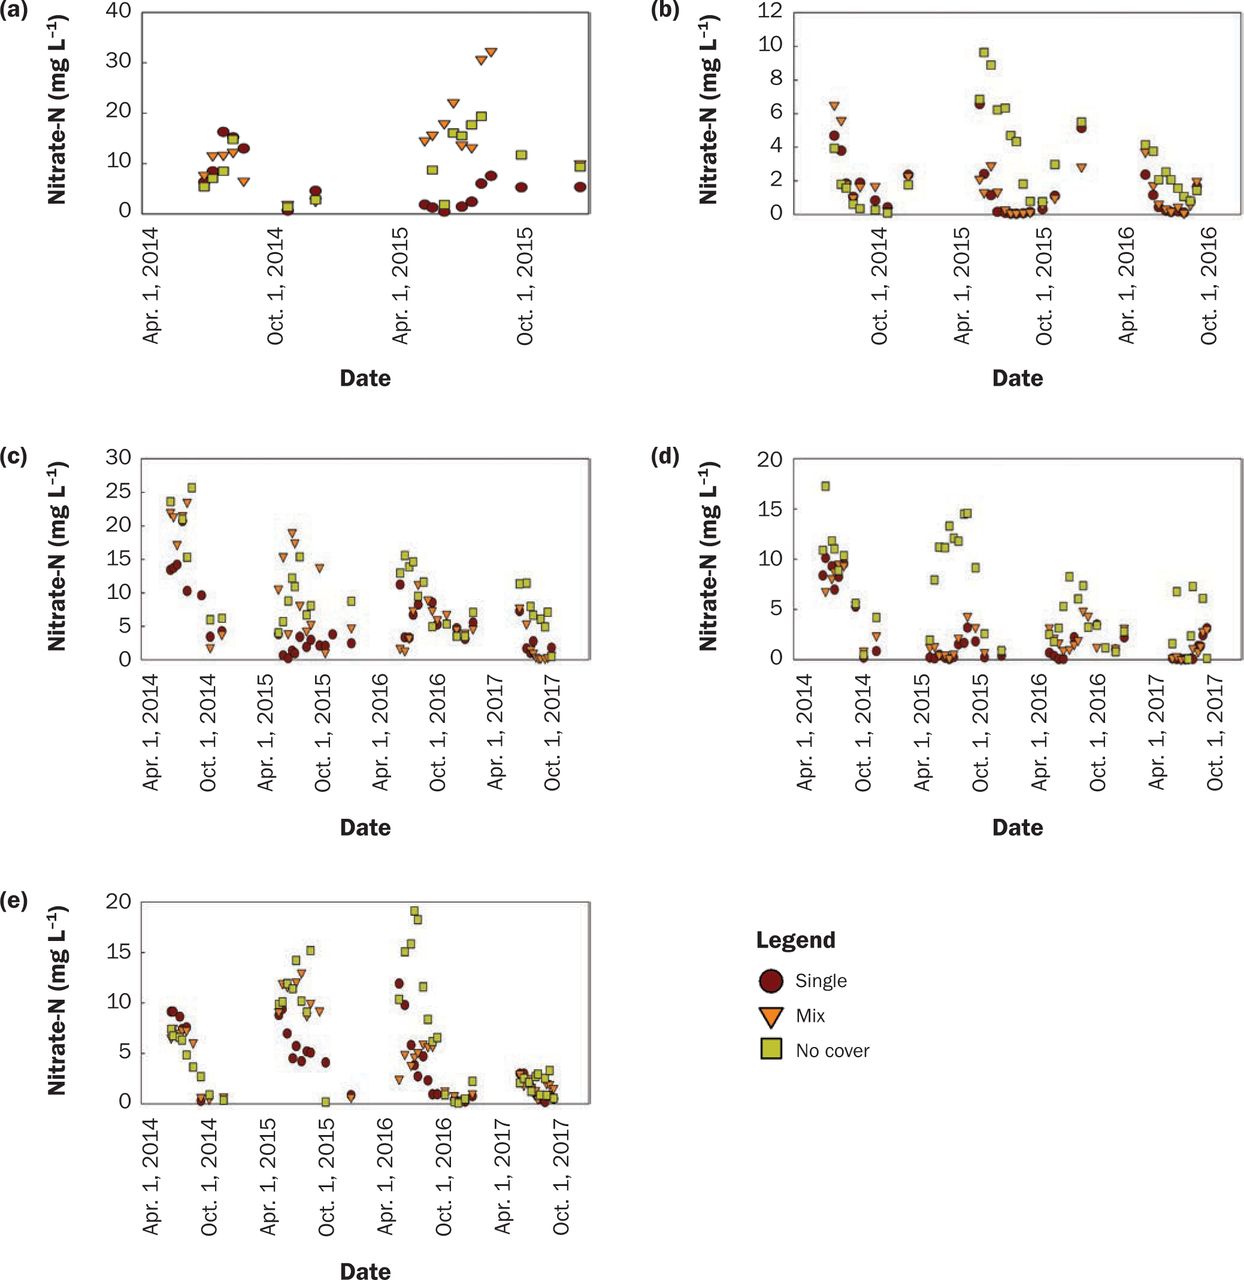
Nitrate-nitrogen (NO3-N) concentration (mg L−1) for soybean water year by location ([a] Lewis, [b] Chariton, [c] Crawfordsville, [d] Kanawha, and [e] Nashua).
Annually, CR-M had significantly less NO3-N concentration than NC at three sites (figures 5b, 5c, 5d, and tables 4 and 5). CR-M was greater than CR-S at Lewis and Kanawha (tables 4 and 5). The relationship at Lewis between the mixture and single species was prominent in 2015 and shown in figure 5a, which had the second-highest brassica biomass at 151.8 kg ha−1 and apparently influenced water quality all year. In short, CR performed the same or better compared to its mixture at improving water quality, likely due to greater growth and higher C/N ratios. Finney et al. (2016) found a positive relationship between N retained and cover crop C/N ratio with many mixtures.
In the corn water year, there was no difference in NO3-N concentration among treatments (tables 4 and 5), where no cover averaged 5.7 mg L−1, the mixture was 5.3 mg L−1, and oats was 5.0 mg L−1. There was a weak interaction between treatment and location; oats improved water quality compared to no cover at Kanawha and Nashua (figure 6e).
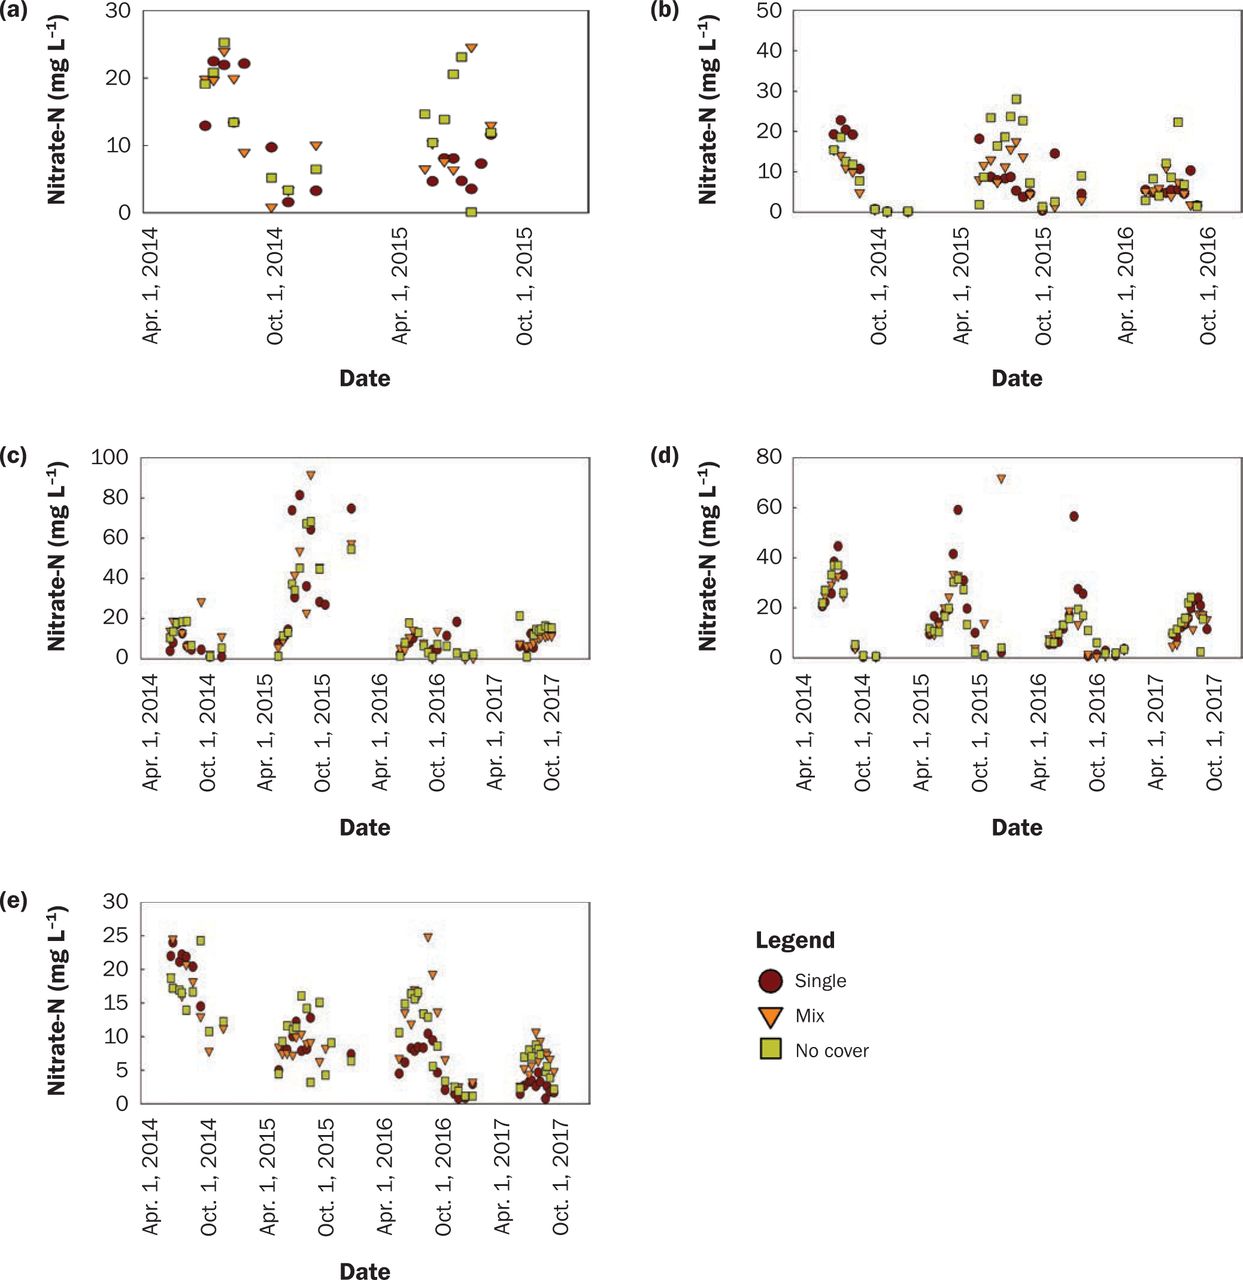
Nitrate-nitrogen (NO3-N) Concentration (mg L−1) for corn water year by location ([a] Lewis, [b] Chariton, [c] Crawfordsville, [d] Kanawha, and [e] Nashua).
There was no evidence of mixture being a risk to water quality compared to no cover in corn or soybean (tables 4 and 5) due to the rapid release of N from brassicas, as seen in Ruark and Franzen (2020). These results support the findings of Kaspar et al. (2012) that CR was more effective than oats at reducing NO3-N concentrations in drainage water.
Seasonal Effect on Water Quality. Samples were taken every two weeks, and there were many more samples in the spring due to wetter conditions. There were 2,395 lysimeter samples collected over 17 site-years, with 1,510 occurring in the spring, 607 in the summer, and 278 in the fall. In soybeans, summer concentration was the highest at 3 mg L−1, then spring at 2.8 mg L−1, and both were significantly greater than fall at 1.75 mg L−1. There was a significant interaction between season and treatment (tables 4 and 5). In the spring, NC (6.19 mg L−1) was greater (p < 0.0001) than CR-M (2.8 mg L−1), which was greater (p < 0.0001) than CR-S (1.35 mg L−1). In the summer, NC (3.8 mg L−1) was greater (p = 0.01) than CR-S (2.7 mg L−1), and both were statistically similar to CR-M (3.1 mg L−1). Fall concentration was the same regardless of treatment.
There was a significant interaction between season, location, and treatment in soybean. At four out of five sites, in the spring, both treatments were less than NC (tables 4 and 5). During spring at Lewis and Crawfordsville, CR-S was significantly less than CR-M. These were the two sites with the most brassica growth (also in the south), indicating a slight negative impact to water quality, but not more than NC. In corn, spring average (10.4 mg L−1) was greater (p = 0.009) than summer (8.3 mg L−1), which was greater (p < 0.0001) than fall (1.7 mg L−1). In the summer and fall there was no effect of treatment. In the spring, NC (11.0 mg L−1) was greater (p = 0.03) than Oats-S (9.2 mg L−1), and Oats-M (10.8 mg L−1) was greater (p = 0.06) than Oat-S but similar to NC.
There was a weak interaction between treatment and location in corn (tables 4 and 5). Oats-S was significantly lower in the spring than both Oats-M and NC at Nashua, but not any other location (tables 4 and 5). This relationship was evident in 2016 and 2017, which had the most cover crop growth at Nashua while lysimeters were present (figure 6e). Similar to the soybean year, the Oats-M species with lower C/N ratios did not pose a risk to spring water quality compared to NC ahead of corn (tables 4 and 5). In fall of 2016 at Crawfordsville, the greatest brassica and legume aboveground biomass was 765 kg ha−1. The following spring, NO3-N concentration in Oats-M was statistically similar to NC but greater than Oats-S.
Treatment Effect on Cash Crop Growth. Overall, there was a treatment effect (p < 0.0001) on soybean yield; mixture (4.4 Mg ha−1) and single (4.4 Mg ha−1) treatments were significantly less than no cover (4.5 Mg ha−1) (table 2). However, there was a significant (p = 0.0211) interaction of treatment and location, meaning the treatment effect varied by location (table 2). There was no treatment effect at Crawfordsville (average = 4.0 Mg ha−1), Kanawha (average = 3.6 Mg ha−1), Chariton (average = 5.0 Mg ha−1), or Nashua (average = 4.6 Mg ha−1). At Lewis, single (4.6 Mg ha−1) and mixture (4.6 Mg ha−1) were significantly less than NC (4.8 Mg ha−1), which occurred in the last three years. There was nothing particular about weather or cover crop growth that explains this pattern (figure 2). At Sutherland, NC (4.8 Mg ha−1) was greater than single (4.5 Mg ha−1) and both were the same as the mixture (4.6 Mg ha−1). This relationship was present most prominently in the first year, where there was no growth in the mixture, indicating treatment carryover.
Corn yields were not influenced by a cover crop and averaged 13.3 Mg ha−1. The only location with a difference in treatment (p = 0.0166) was at Crawfordsville, between no cover (14.0 Mg ha−1) and single (13.7 Mg ha−1). Both were the same as the mixture overall (13.7 Mg ha−1). We hypothesized that hairy vetch could benefit the following corn crop due to N fixation and recycling (Finney et al. 2016; White et al. 2017). Corn yield in the mixture treatment never out-performed NC when associated with the spring hairy vetch growth in this study. Appelgate et al. (2017) reported lower chlorophyll at V6 and R1 stage in corn from some mixtures. Still, overall, there was no influence on corn grain yield from their cover crop mixtures, including CR or its mixtures ahead of corn (not present in this study). Kaspar et al. (2012) reported that oats negatively influenced corn yield in two out of three years with greater seeding rates and fall growth in central Iowa.
Treatment Effect on Soil Properties. After five years of treatment, there was no effect on MWD, TC, or TN at any of the four locations or at either depth (table 6). Surprisingly, there was an increase in NC and single (p < 0.0001) compared to their initial C contents, but no influence in the mixture treatment. Each location in this study had no-tillage, so there were consistent organic inputs even in the control. However, we expected that the mixture sites, especially at Lewis with substantial growth of both grasses and legumes, would increase their C content. Additionally, the increase in C was not statistically greater in the single treatment (0.46% increase) than NC (0.44% increase). Steele et al. (2012) reported an increase in water stable aggregates after 12 years of CR as a cover crop. Villamil et al. (2006) reported an increase in water-aggregate stability after just two years with a vetch-CR bi-culture seeded at twice our rate in Illinois.
Results of analysis of variance for soil variables. Fixed effects are treatment (trt), location, and their interaction.
Summary and Conclusions
In this study spanning 32 site-years across six sites in Iowa, we investigated the impact of a single species cover crop or multiple species with a mixture on water quality and evaluated the growth performance of treatments to better inform farmers in their species selection process. Oats performed the same or better compared to an oats-hairy vetch-radish mixture with respect to improving water quality. The mixture performed the same or better compared to the single species with respect to cover crop growth. Neither cover crop treatment negatively influenced corn yield. Oats produced an average of 300 kg ha−1 in the fall at six sites in Iowa, and its mixture yielded 320 kg ha−1 with occasional radish growth exceeding 590 kg ha−1 in the southern sites. There was a 16% decrease in spring NO3-N concentration in soil pore water compared to NC with oats, and no difference between NC and the oats mixture. The winter CR-S treatment performed the same or better as the cereal rye-radish-rapeseed in biomass production and water quality improvement. There was a 78% decrease in spring NO3-N concentration with winter CR compared to NC and a 55% decrease with the mixture. Spring cover crop growth was much better in the north compared to the south and in the single species treatment compared to the mixture, likely due to increased winter CR density from the fall growth in both situations. Fall growth with winter CR was 183 kg ha−1, and its mixture had fall growth of 156 kg ha−1. Effect of treatment on spring growth was more pronounced with 1,735 kg ha−1 in the single species with winter CR and 1,274 kg ha−1 in the mixture.
There was no negative impact on water quality with the addition of a cover crop even with lower C/N ratios in the mixture and winterkill treatments. There were no adverse impacts to soybean yield with either cover crop treatment at four out of six sites. Overall, oats were a promising addition to a corn–soybean rotation ahead of corn because there were water quality improvements with no yield impacts. Hairy vetch winter-killed all but 4 out of 32 site-years, but twice it grew to >500 kg ha−1. Future research in Iowa should focus on improving hairy vetch survival, perhaps by pairing it with a winter surviving grass. There were no measurable results to soil quality from the presence of one or multiple species of cover crops. Long-term studies with more growth may be needed to detect these differences because there are likely benefits especially with the variety of C/N ratios introduced to the system. This is the most robust data set of cover crop mixtures in the state of Iowa, and we propose the following to diversify cover crops in Iowa: winter CR before soybeans, oats and/or an oat mixture before corn, and introducing brassicas and hairy vetch in southern Iowa. In this research, we broadcast seeded into a standing crop in late August or early September, and therefore suggest those conditions to plant diversified cover crop species in Iowa.
Supplemental Material
The supplementary material for this article is available in the online journal at https://doi.org/10.2489/jswc.2023.00174.
Acknowledgements
We thank the undergraduate interns working at Iowa Learning Farms from summers 2014 to 2017 who collected lysimeter water samples throughout each season. We also thank the staff at the six Iowa State University Research and Demonstration Sites.
This project was funded by USDA Natural Resources Conservation Service (NRCS) through a National Conservation Innovation Grant, The Leopold Center for Sustainable Agriculture, and Iowa Department of Agriculture and Land Stewardship. Partners on the project include Iowa Learning Farms under the leadership of Jacqueline Comito, Practical Farmers of Iowa, NRCS, Conservation Districts of Iowa, and Iowa Cover Crop Working Group.
- Received December 7, 2021.
- Revision received May 25, 2022.
- Accepted June 8, 2022.
- © 2023 by the Soil and Water Conservation Society
References
In this issue


Jump to section
Related Articles
Cited By...
- No citing articles found.