


Abstract
To date, there are no crop mutants described in the literature that display both Cd accumulation and tolerance. In the present study a unique pea ( Pisum sativum ) mutant SGECd t with increased Cd tolerance and accumulation was isolated and characterized.
Ethylmethane sulfonate mutagenesis of the pea line SGE was used to obtain the mutant. Screening for Cd-tolerant seedlings in the M 2 generation was performed using hydroponics in the presence of 6 µ m CdCl 2 . Hybridological analysis was used to identify the inheritance of the mutant phenotype. Several physiological and biochemical characteristics of SGECd t were studied in hydroponic experiments in the presence of 3 µ m CdCl 2 , and elemental analysis was conducted.
The mutant SGECd t was characterized as having a monogenic inheritance and a recessive phenotype. It showed increased Cd concentrations in roots and shoots but no obvious morphological defects, demonstrating its capability to cope well with increased Cd levels in its tissues. The enhanced Cd accumulation in the mutant was accompanied by maintenance of homeostasis of shoot Ca, Mg, Zn and Mn contents, and root Ca and Mg contents. Through the application of La +3 and the exclusion of Ca from the nutrient solution, maintenance of nutrient homeostasis in Cd-stressed SGECd t was shown to contribute to the increased Cd tolerance. Control plants of the mutant (i.e. no Cd treatment) had elevated concentrations of glutathione (GSH) in the roots. Through measurements of chitinase and guaiacol-dependent peroxidase activities, as well as proline and non-protein thiol (NPT) levels, it was shown that there were lower levels of Cd stress both in roots and shoots of SGECd t . Accumulation of phytochelatins [( PCcalculated ) = ( NPT )−( GSH )] could be excluded as a cause of the increased Cd tolerance in the mutant.
The SGECd t mutant represents a novel and unique model to study adaptation of plants to toxic heavy metal concentrations.
INTRODUCTION
The heavy metal (HM) cadmium (Cd) is a widespread pollutant in the surface soil layer and is toxic to most organisms including plants. In pea ( Pisum sativum ), Cd at rather low concentrations inhibits root and shoot growth, as well as water and nutrient uptake, disturbs photosynthesis and activities of various enzymes, and induces oxidative stress ( Sandalio et al. , 2001 ; Metwally et al. , 2005 ; Rodriguez-Serano, 2006 ).
Plant HM-homeostasis and HM-tolerance are genetically determined. Genetic analysis of natural plant populations suggests that metal tolerance is determined by one or two major genes ( Schat et al. , 1993 ). Cadmium sensitivity and accumulation often vary between closely related genotypes in single species including pea ( Belimov et al. , 2003 ; Metwally et al. , 2005 ). However, it is still not clear whether Cd tolerance and accumulation are genetically independent or related traits. Analyses of F 2 populations from crosses of A. halleri and A. petraea ( Bert et al. , 2003 ) and from interecotypic crosses of Thlaspi caerulescens ( Zha et al. , 2004 ) demonstrated that Cd tolerance and Cd hyperaccumulation are genetically independent. However, Lombi et al. (2000) showed that both traits appeared to be linked in T. caerulescens .
Along with genetic analyses of variability in HM tolerance and accumulation in natural plant populations, the mutational approach offers a powerful tool to study the genetic and molecular mechanisms protecting plants against toxic metals. Surprisingly, mutant selections in respect to increased tolerance and accumulation have rarely been performed and described to date, probably because only few mutants showing altered HM tolerance and uptake could be obtained. Cadmium-sensitive mutants cad1 and cad2 of A. thaliana were shown to be deficient in phytochelatin (PC) synthase ( Howden et al. , 1995 b ; Ha et al. , 1999 ) and γ-glutamylcysteine synthetase ( Cobbett et al. , 1998 ), respectively, demonstrating the important role of PCs in Cd detoxification. Gottschalk (1987) and Welch and LaRue (1990) isolated two mutants of pea, i.e. A79-397 ( dgl ) and E107 ( brz ), respectively, with an abnormally high uptake of Fe and characteristic necrotic spots on leaves due to Fe toxicity. The roots of the E107 ( brz ) released Fe(III)-reducing substances to the surrounding medium at higher rates than the wild-type cultivar ‘Sparkle’, suggesting that the mutant acts functionally as an Fe-deficient plant ( Welch and LaRue, 1990 ). In addition, the E107 ( brz ) mutant excessively accumulated aluminium and manifested symptoms typical of Al toxicity ( Guinel and LaRue, 1993 ). Increased Cu sensitivity of the A. thaliana mutant cup1 ( Van Vliet et al. , 1995 ) was associated with enhanced accumulation of the metal in plant tissues. The A. thaliana mutant man1 was characterized by a chlorotic dwarf phenotype and excessive accumulation of Mn, Cu and Zn, suggesting disruption in regulation of metal uptake or homeostasis ( Delhaize, 1996 ). Characterization of the mutants described above showed that modifications in single genes significantly affect HM tolerance and accumulation, but no successful experiments have been reported where mutagenesis of plants improved both characteristics.
However, simultaneous increase in HM tolerance and accumulation was demonstrated using transgenic Arabidopsis plants whereby genes encoding HM transport proteins that alter sequestration and detoxification of toxic metals were manipulated. Transformation of A. thaliana with cation diffusion facilitators (CDF) ZAT ( Van der Zaal et al. , 1999 ) and PtdMTP1 ( Blaudez et al. , 2003 ) led to enhanced Zn tolerance and accumulation. Arabidopsis thaliana overexpressing the AtHMA4 gene encoding the P 1B -ATPase transporter increased root tolerance as well as root-to-shoot translocation of toxic Zn and Cd ( Verret et al. , 2004 ; Mills et al. , 2005 ). Enhanced tolerance and accumulation of Cd was observed in transgenic Arabidopsis carrying the yeast ATP-binding cassette (ABC) transporter YCF1 due to the accelerated uptake of GSH-Cd complexes into vacuoles ( Song et al. , 2003 ). All these studies show the potential of transgenic and mutant work in relation to HM tolerance and encourages further screening programmes to be conducted.
To understand the mechanisms of Cd tolerance and detoxification, pea plants were chemically mutagenized and hydroponically screened for a relieved growth response to Cd toxicity. A novel and unique pea mutant SGECd t was identified and characterized for its increased Cd tolerance and Cd accumulation.
MATERIALS AND METHODS
Isolation and genetic analysis of the Cd-tolerant mutant
Seeds of the laboratory pea ( P. sativum L.) line SGE were surface-sterilized and scarified by treatment with 98 % H 2 SO 4 for 30 min, rinsed carefully with tap water and mutagenized by soaking in 0·15 % (v/v) ethylmethane sulfonate water solution at room temperature for 15 h. To obtain seeds of the M2 generation, the mutagenized M1 seeds were transferred to vermiculite and cultivated in a greenhouse as described by Belimov et al. (2003). The seeds of the M 2 generation originating from 350 M1 lines were transferred to plastic containers (approx. 100 seeds per container) containing each 3 L of nutrient solution (μ m ): KH 2 PO 4 , 110; Ca(NO 3 ) 2 , 50; MgSO 4 , 400; KCl, 300; CaCl 2 , 70; NaCl, 5; Fe-tartrate, 2; H 3 BO 3 , 1; MnSO 4 , 1; ZnSO 4 , 1; Na 2 MoO 4 , 0·03; CuSO 4 , 0·8; pH 5·5. The containers were placed in a growth chamber (HPS2000; Heraeus Vötch GmbH, Balingen, Germany) with a day/night cycle of 16 h/8 h, at 21 °C, 75 % relative humidity and a photon flux density during the light phase of 400 µmol quanta m −2 s −1 . The seeds were germinated for 5 d at which time the nutrient solution was replaced and supplemented with 8 µ m CdCl 2 . After cultivation for 4 d, the nutrient solution was replaced and supplemented with 6 µ m CdCl 2 . In preliminary experiments, the chosen Cd concentrations completely terminated the root growth of wild-type SGE. Growth of seedlings was visually monitored during cultivation for 17 d in the presence of 6 µ m CdCl 2 in a solution that was replaced every fourth day. Seedlings of one M2 family demonstrated better shoot growth and were able to develop lateral roots at this toxic Cd concentration. These seedlings were transferred to vermiculite and seeds of M3 and M4 generations were subsequently obtained. M4 plants generated from one tolerant M2 seedling were used for crosses with wild-type SGE in accordance with classical hybridological analysis to determine the number of genes controlling the mutant phenotype. The F2 population was grown in hydroponic culture under selective Cd concentrations as described above and analysed for segregation of Cd-sensitive and Cd-tolerant plants by visual inspection of shoot and root growth.
Hydroponic culture for physiological and biochemical studies
Seeds were treated as described above and germinated on filter paper in Petri dishes for 3 d at 25 °C in the dark. Seedlings were transferred to plastic pots (two pots with three seeds per genotype and treatment) containing 500 mL of nutrient solution (see above). For calcium (Ca) deficiency, KNO 3 (100 µ m ) was substituted for Ca(NO 3 ) 2 , and the KCl concentration was reduced down to 200 µ m . One day after transfer, CdCl 2 was added to the solution in the range 0·5–16 µ m as indicated. If necessary, the solution was supplemented with 30 µ m LaCl 3 on the day of transfer. The plants were cultivated for 12 d in a growth chamber with a day/night cycle of 12 h/12 h, at 23 °C/18 °C, a relative humidity between 50 % and 60 % and a photon flux density of 170 µmol quanta m −2 s −1 . The non-aerated nutrient solution was replaced at the fifth and the eighth day after transfer. The root and shoot fresh weight (f. wt) was determined for each plant. Leaves were either extracted for intercellular washing fluids (IWF) or processed for protoplast isolation. Roots were soaked in 5 m m Pb-citrate solution (pH 11) for 10 min and washed in deionized water for desorption of apoplastically bound Cd. For biochemical analyses, leaves and roots were frozen in liquid nitrogen and stored at –80 °C. For elemental analysis, plants were dried at 60 °C.
Intercellular washing fluid (IWF) extraction
Leaves were cut and immediately vacuum-infiltrated with deionized water using a plastic syringe, surface dried on a filter paper and placed with cut-side upwards in 0·5-mL Eppendorf tubes with a hole on the bottom. The tubes with the leaves were placed in 1·5-mL Eppendorf tubes and centrifuged at 5000 g at room temperature for 10 min. The collected IWF was acidified with concentrated HNO 3 up to a final acid concentration of 10 % (v/v) to prevent contamination with microorganisms and stored at –20 °C until analysis. The amount of extracted IWF was monitored by weighing the leaves before and after infiltration. Leaves following IWF extraction were dried at 60 °C, ground and analysed for Cd content.
Protoplast isolation
Leaves were sliced into 2-mm pieces with a sharp razor and vacuum-infiltrated with 10 mL sorbitol medium comprised of 400 m m sorbitol, 20 mM KCl, 10 m m CaCl 2 and 20 m m MES (pH 5·7) supplemented with 1·5 % (v/v) Cellulase Onozuka R10 and 0·4 % (v/v) macerozyme R10. Subsequently, they were incubated in Petri dishes for 2·5 h at 30 °C in the dark (essentially as in Brune et al. , 1995 ). After gentle shaking, the released protoplasts were filtered through a nylon net and layered on top of 1 mL of Percoll ® medium [400 m m sorbitol, 20 m m KCl, 10 m m CaCl 2 , 20 m m MES (KOH, pH 5·7)]. After centrifugation (800 g , 1 min, 4 °C), the upper part of the sorbitol medium was discarded and protoplasts gently mixed with the Percoll medium to reach a final Percoll concentration of about 50 %. A discontinuous gradient was formed by successively layering 40 %, 30 % and 20 % Percoll medium and sorbitol medium (v/v). After successive centrifugation at 4 °C for 3 min each at 800 g and 3000 g , the protoplast fraction was collected from the interphase at 40 % and 30 % Percoll, transferred to a new centrifugation tube with 8 mL sorbitol medium and sedimented at 800 g and 4 °C for 3 min. The purity and intactness of the protoplasts were controlled under a light microscope. The purified protoplasts were transferred to Eppendorf tubes and their number estimated via chlorophyll content measurement ( Dietz et al. , 1992 ; Brune et al. , 1995 ). The protoplast suspensions were acidified with concentrated HNO 3 up to a final acid concentration of 10 % (v/v) to prevent contamination with microorganisms and stored at –20 °C until analysis.
Elemental analysis
The content of total nitrogen in pulverized dried plants was determined by the Kjeldahl method using a Kjeltec Auto 1030 analyser (Tecator AB, Hoganas, Sweden). For determination of other elements, the powdered samples, IWF and protoplasts were digested in 10 % HNO 3 (v/v) at 165 °C under pressure. The extracts were analysed with an inductively coupled plasma atomic emission spectrometer (Jobin Yvon JY 70; Instruments S.A., Longjumeau, France). The element contents of the samples were quantified by comparison with standard solutions at appropriate dilutions (Merck, Darmstadt, Germany): 10 µg mL −1 P and K, 2 µg mL −1 Mg, S and Ca, and 0·1 µg mL −1 Cd, Fe, Mn, Zn, Na, B and Al ( Brune et al. , 1995 ).
Biochemical analyses
For determination of total non-protein thiols (NPT) and glutathione (GSH), the plant materials (100 mg f. wt) were homogenized in 100 m m HCl/5 m m EDTA solution, the extracts ultrasonicated for 30 s, and centrifuged at 10 000 g and 4 °C for 20 min. The concentration of NPT in supernatants was determined as described by Noctor and Foyer (1988) . Contents of total and reduced GSH were determined fluorimetrically after derivatization with monobromobimane and subsequent fractionation on an Agilent Hypersil BDS-C18 column by HPLC (Hewlett Packard Series 1050, Waldbronn, D) as described in Finkemeier et al. (2003).
For determination of guaiacol-dependent peroxidase (POX) activity by the method of Adam et al. (1995), the plant material (100 mg f. wt) was homogenized in 100 m m Hepes/KOH buffer (pH 7·4) and centrifuged at 10 000 g at 4 °C for 10 min. For chitinase the plant material (200 mg f. wt) was homogenized in 100 m m K-acetate buffer (pH 5·5) and spun at 12 000 g at 4 °C for 10 min. Chitinase activity was measured using the substrate carboxy-methyl chitin remazol brilliant violet (CM-chitin-RBV; Blue Substrates, Göttingen, Germany) according to the method described by Wirth and Wolf (1990) . Free proline content was measured in plant samples (200 mg f. wt) ground in 3 % sulfosalicylic acid according to the method of Bates et al. (1973).
Statistical analysis
The data were processed by analysis of variance (MANOVA), the Student's t -test and Pearson correlation using the software STATISTICA version 5·5 (StatSoft, Inc., USA) and standard errors (s.e.), standard deviations (s.d.) and the chi-square criterion (χ 2 ) were calculated.
RESULTS
Cd tolerance is determined by a recessive mutation in a single gene
The hybrid analysis of reciprocal crosses between the Cd-tolerant mutant and the wild type revealed that the mutant is characterized by a monogenic inheritance with a recessive phenotype manifestation (Table 1 ). F2 segregants with mutant phenotype were used for further seed propagations. The stable mutant line denominated SGECd t was obtained after selection of the F5 generation and used for all physiological and biochemical tests described below.
Segregation analysis of F 2 population from reciprocal crosses between Cd-tolerant mutant and wild-type SGE
| Crosses | Number of plants in F2 population | χ 23:1 | |
|---|---|---|---|
| Cd sensitive | Cd tolerant | ||
| SGE × Cd-tolerant mutant | 92 | 31 | 0·003 |
| Cd-tolerant mutant × SGE | 50 | 13 | 0·640 |
| Total | 142 | 44 | 0·179 |
| Crosses | Number of plants in F2 population | χ 23:1 | |
|---|---|---|---|
| Cd sensitive | Cd tolerant | ||
| SGE × Cd-tolerant mutant | 92 | 31 | 0·003 |
| Cd-tolerant mutant × SGE | 50 | 13 | 0·640 |
| Total | 142 | 44 | 0·179 |
The plants were grown in the nutrient solution supplemented with 6 µ m of CdCl 2 .
To quantify the dose-response to Cd toxicity, the plants were tested in hydroponics in a concentration range between 0·5 µ m and 16 µ m CdCl 2 . At 6·0 µ m CdCl 2 root growth of the wild-type plants was completely inhibited, whereas the mutant roots developed even at 16 µ m CdCl 2 (data not shown). From these experiments, the appropriate Cd concentration of 3·0 µ m was chosen for all further experiments. This concentration generated a striking growth difference between SGE and SGECd t plants (Fig. 1 ). Biomass of SGE and SGECd t was similar in the absence of Cd, whereas treatment with 3·0 µ m CdCl 2 led to a significant decrease in root biomass of both genotypes and shoot biomass of SGE (Fig. 2 ).
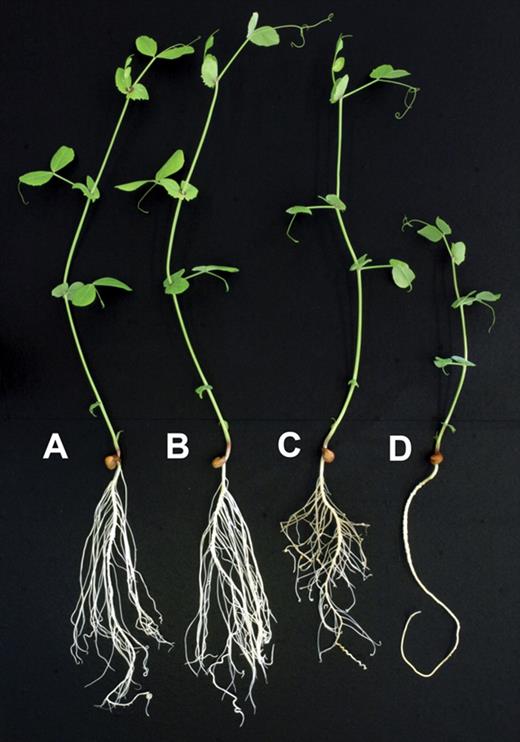
Typical plants of the Cd-tolerant mutant SGECd t (A, C) and wild-type SGE line (B, D) grown for 10 d in hydroponics in the absence (A, B) or presence of 3 µ m CdCl 2 (C, D).
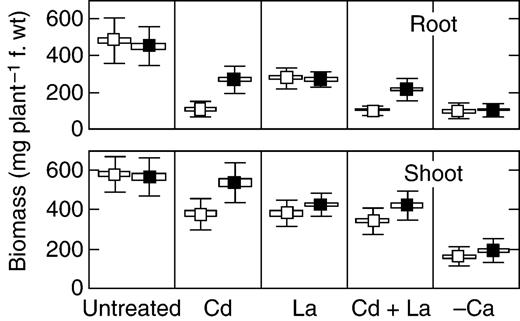
Root and shoot biomass of SGE (open symbols) and SGECd t (closed symbols) plants grown for 10 d in complete nutrient solution (‘Untreated’), supplemented with 3 µ m CdCl 2 (Cd), 30 µ m LaCl 3 (La), 3 µ m CdCl 2 and 30 µ m LaCl 3 (Cd + La) or in Ca-deficient solution (‘–Ca’). Data are the mean ± s.e. (box) and ± s.d. (bars). Averages in treatments ‘Untreated’ and ‘Cd’ are means of six experiments with six plants each. Averages in treatments ‘Cd + La’ and ‘–Ca’ are means of three experiments with six plants each.
SGECd t has a high ability to accumulate Cd and to maintain nutrient element homeostasis
When grown with cadmium, root and in particular shoot tissue from SGECd t contained more Cd than wild-type SGE (Tables 2 and 3 ). Total Cd taken up by mutant roots and shoots was higher by the factor of 3 and 3·5, respectively (data not shown). The mutant has increased Cd concentrations in IWF (dissolved fraction; P = 0·035, Student's t -test) and leaves following IWF extraction (intracellular and cell wall-bound fraction; P = 0·042, Student's t -test; Fig. 3 ). Element analysis of mesophyll protoplasts (mesophyll-specific intracellular fraction) revealed that Cd was higher by the factor of 2·4 in the SGECd t , but the genotypic difference was insignificant when analysed by Student's t -test ( P = 0·13) because of high variation of the data for the mutant protoplasts (Fig. 3 ).
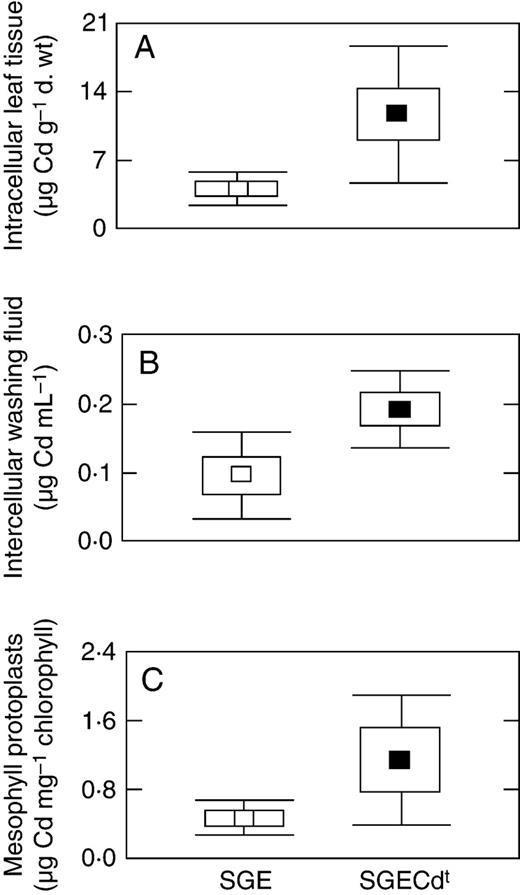
Cadmium compartmentation in leaves of SGE (open symbols) and SGECd t (closed symbols) plants grown for 10 d in nutrient solution supplemented with 3 µ m CdCl 2 . Leaf fractions: (A) intracellular leaf tissue; (B) intercellular washing fluid; (C) mesophyll protoplasts. Data are the mean ± s.e. (box) and ± s.d. (bars). Averages in (A) and (B) are means of three experiments with one or two determinations each. Averages in (C) are means of two experiments with two determinations each.
Root element composition of SGE and SGECd t plants grown for 10 d in hydroponic culture
| Element | Untreated plants | Cd-treated plants | La-treated plants | Cd + La-treated plants | Minus-Ca plants | |||||
|---|---|---|---|---|---|---|---|---|---|---|
| SGE | SGECd t | SGE | SGECd t | SGE | SGECd t | SGE | SGECd t | SGE | SGECd t | |
| N ‡ | 31 ± 2 | 36 ± 2 | 49 ± 5* | 44 ± 4 | n.d. | n.d. | n.d. | n.d. | n.d. | n.d. |
| P ‡ | 8·3 ± 0·4 | 9·2 ± 0·7 | 6·9 ± 0·4* | 7·0 ± 0·3* | 7·1 ± 0·2 | 7·4 ± 0·6 | 7·0 ± 0·2* | 6·8 ± 0·7* | 8·7 ± 0·7 | 7·9 ± 0·9 |
| K ‡ | 40 ± 2 | 40 ± 3 | 36 ± 1 | 37 ± 2 | 19 ± 2* | 20 ± 1* | 18 ± 1* | 20 ± 3* | 29 ± 6 | 26 ± 6 |
| Mg ‡ | 1·17 ± 0·02 | 1·24 ± 0·05 | 1·11 ± 0·03 | 1·37 ± 0·05 † | 0·90 ± 0·02* | 0·83 ± 0·04* | 0·90 ± 0·04* | 0·89 ± 0·03* | 5·01 ± 0·07* | 4·69 ± 0·29 |
| Ca ‡ | 1·57 ± 0·05 | 1·51 ± 0·05 | 1·14 ± 0·06* | 1·33 ± 0·03* † | 1·17 ± 0·04* | 1·15 ± 0·09* | 0·92 ± 0·03* | 1·01 ± 0·03* | 0·37 ± 0·03* | 0·33 ± 0·02 |
| S ‡ | 9·5 ± 0·7 | 9·2 ± 0·9 | 5·7 ± 0·4* | 7·5 ± 0·9 | 4·3 ± 0·4* | 4·1 ± 0·3* | 4·7 ± 0·2* | 5·1 ± 0·7* | 6·9 ± 1·5 | 6·8 ± 1·5 |
| Fe ‡ | 1·2 ± 0·2 | 1·3 ± 0·2 | 0·8 ± 0·1 | 1·2 ± 0·2 | 3·5 ± 0·2* | 3·6 ± 0·1* | 2·7 ± 0·1* | 3·1 ± 0·4* | 1·3 ± 0·1 | 1·8 ± 0·1 |
| Na ‡ | 2·5 ± 0·2 | 2·7 ± 0·3 | 1·7 ± 0·2* | 1·9 ± 0·2* | 1·8 ± 0·2* | 1·7 ± 0·1* | 1·5 ± 0·1* | 1·9 ± 0·3 | 1·9 ± 0·2 | 2·0 ± 0·1 |
| Zn § | 334 ± 26 | 320 ± 18 | 411 ± 33 | 440 ± 20* | 232 ± 17* | 228 ± 13* | 296 ± 17 | 310 ± 25 | 567 ± 99* | 515 ± 75 |
| Mn § | 33 ± 2 | 25 ± 4 | 16 ± 1* | 16 ± 1* | 22 ± 1* | 21 ± 1 | 16 ± 0·4* | 15 ± 0·3 | 66 ± 3* | 61 ± 4 |
| B § | 17 ± 2 | 17 ± 2 | 17 ± 2 | 19 ± 2 | 22 ± 1 | 21 ± 1 | 25 ± 1* | 16 ± 4 | 34 ± 5* | 32 ± 3 |
| Cd § | 1·7 ± 0·3 | 1·2 ± 0·3 | 427 ± 30* | 510 ± 22* † | 1·3 ± 0·5 | 1·8 ± 0·6 | 296 ± 5* | 335 ± 4* † | 2·9 ± 1·1 | 3·0 ± 1·3 |
The data for Untreated and Cd-treated (3 µ m CdCl 2 ) plants are the mean ± s.e. of six experiments with one or two determinations each. The data for La-treated (30 µ m LaCl 3 ), La + Cd-treated (3 µ m CdCl 2 and 30 µ m LaCl 3 ), and Minus Ca plants are the mean ± s.e. of three experiments with one or two determinations each.
n.d., Not determined.
*Significant effect of treatment on a given pea genotype as compared with untreated plants (Student's t -test, P ≤0·05).
† Significant difference between pea genotypes at a given treatment (Student's t -test, P ≤0·05).
‡ Content of element is given as mg g −1 d. wt.
§ Content of element is given as μg g −1 d. wt.
Shoot element composition of SGE and SGECd t plants grown for 10 d in hydroponic culture
| Element | Untreated plants | Cd-treated plants | La-treated plants | Cd + La-treated plants | Minus-Ca plants | |||||
|---|---|---|---|---|---|---|---|---|---|---|
| SGE | SGECd t | SGE | SGECd t | SGE | SGECd t | SGE | SGECd t | SGE | SGECd t | |
| N ‡ | 22 ± 2 | 26 ± 4 | 39 ± 3* | 31 ± 2 | n.d. | n.d. | n.d. | n.d. | n.d. | n.d. |
| P ‡ | 3·4 ± 0·1 | 3·9 ± 0·2 † | 4·2 ± 0·2* | 4·6 ± 0·2* | 3·3 ± 0·1 | 3·5 ± 0·05 | 3·4 ± 0·07 | 3·6 ± 0·1 | 6·1 ± 0·2* | 6·0 ± 0·3* |
| K ‡ | 17·1 ± 1·0 | 17·3 ± 1·3 | 14·4 ± 0·8 | 14·7 ± 1·2 | 13·5 ± 0·4* | 13·1 ± 0·3* | 11·4 ± 0·7* | 11·7 ± 0·3* | 16·4 ± 1·6 | 15·3 ± 1·4 |
| Mg ‡ | 2·60 ± 0·10 | 2·63 ± 0·13 | 2·21 ± 0·13* | 3·16 ± 0·11* † | 1·51 ± 0·04* | 1·68 ± 0·01* † | 1·56 ± 0·15* | 1·54 ± 0·11* | 3·31 ± 0·73 | 3·42 ± 0·77 |
| Ca ‡ | 1·38 ± 0·08 | 1·40 ± 0·10 | 0·84 ± 0·07* | 1·42 ± 0·07 † | 0·41 ± 0·02* | 0·48 ± 0·01* † | 0·44 ± 0·05* | 0·52 ± 0·05* | 0·11 ± 0·01* | 0·11 ± 0·01* |
| S ‡ | 4·0 ± 0·1 | 4·1 ± 0·2 | 4·9 ± 0·4* | 5·0 ± 0·3* | 3·7 ± 0·1 | 4·1 ± 0·1 † | 3·9 ± 0·3 | 3·6 ± 0·2 | 4·7 ± 0·8 | 5·2 ± 0·6* |
| Fe § | 66 ± 4 | 73 ± 5 | 57 ± 7 | 71 ± 12 | 102 ± 5* | 121 ± 1* † | 69 ± 8 | 103 ± 6* † | 108 ± 28* | 98 ± 7* |
| Na § | 37 ± 7 | 37 ± 4 | 39 ± 5 | 40 ± 5 | 37 ± 1 | 35 ± 2 | 37 ± 1 | 33 ± 3 | 44 ± 2 | 41 ± 2 |
| Zn § | 72 ± 5 | 75 ± 4 | 41 ± 2* | 76 ± 5 † | 47 ± 3* | 61 ± 6 | 32 ± 4* | 51 ± 7* † | 72 ± 26 | 85 ± 19 |
| Mn § | 31 ± 1 | 30 ± 1 | 17 ± 1* | 23 ± 1* † | 17 ± 0·6* | 19 ± 0·7* | 14 ± 1* | 14 ± 1* | 40 ± 12 | 40 ± 11 |
| B § | 22 ± 1 | 22 ± 1 | 9 ± 1* | 12 ± 1* † | 12 ± 1* | 12 ± 1* | 6·5 ± 0·5* | 9·6 ± 0·8* † | 18 ± 4 | 17 ± 3 |
| Cd § | 0·10 ± 0·03 | 0·07 ± 0·04 | 21·4 ± 3·2* | 51·9 ± 3·4* † | 0·03 ± 0·01* | 0·05 ± 0·03 | 7·6 ± 1·8* | 9·7 ± 1·0* | 0·06 ± 0·02 | 0·03 ± 0·02 |
The data for Untreated and Cd-treated (3 µ m CdCl 2 ) plants are the mean ± s.e. of six experiments with one or two determinations each. The data for La-treated (30 µ m LaCl 3 ), La + Cd-treated (3 µ m CdCl 2 and 30 µ m LaCl 3 ), and Minus Ca plants are the mean ± s.e. of three experiments with one or two determinations each.
n.d., Not determined.
*Significant effect of treatment on a given pea genotype as compared with untreated plants (Student's t -test, P ≤0·05).
† Significant difference between pea genotypes at a given treatment (Student's t -test, P ≤0·05).
‡ Content of element is given as mg g −1 d. wt.
§ Content of element is given as μg g −1 d. wt.
Untreated SGE and SGECd t plants showed no difference in element composition with the exception that the mutant had increased shoot P content (Tables 2 and 3 ). In both genotypes, treatment with Cd decreased root P, Ca, Na and Mn contents and shoot Mn and B contents, whereas shoot P and S contents increased. The Cd-treated SGE plants also revealed decreased contents of S in roots and Mg, Ca and Zn in shoots. Contrary to the wild type, the Cd-treated mutant had increased root Zn content and shoot Mg content. In the presence of toxic Cd, significant differences between SGE and SGECd t appeared in root Mg and Ca contents (Table 2 ), and in shoot Mg, Ca, Zn, Mn and B contents (Table 3 ). Certainly, the most striking distinction under Cd stress was the maintenance of high Ca in the roots and shoots of the mutant while a severe Ca drop was seen in the wild type.
It was evident that disturbances in element composition of plants caused by Cd were less pronounced in SGECd t as compared with wild-type SGE. To test the physiological significance of the observed differences in plant element composition for plant growth, the plants were treated with lanthanum (La), an inhibitor of Ca channels. Upon La treatment, a negative effect on root biomass (Fig. 2 ) and disturbances in root element composition (Table 2 ) of SGE and SGECd t plants were similar, with the exception that the Mn content in the mutant root was not affected. However, the La-induced reduction in shoot growth in SGECd t was less than in SGE (Fig. 2 ). Although La-treated plants had decreased shoot K, Mg, Ca, Zn, Mn and B contents, the contents of Mg, Ca, S and Fe in shoots were higher in the mutants than in the wild type (Table 3 ). Generally, La-treated plants showed a greater extent of decrease in element contents than Cd-treated plants. However, the observed decrease in nutrient contents was not accompanied by further inhibition of plant growth, except that shoot biomass of La-treated SGECd t significantly decreased as compared with Cd-treated ones (Fig. 2 ).
When the plants were grown in Cd-supplemented nutrient solution, additional treatment with La caused significant growth inhibition in SGECd t , whereas the growth of SGE was very little affected as compared with Cd-treated plants without La (Fig. 2 ). In both Cd-treated genotypes, addition of La decreased contents of K, Mg, Ca and Cd in roots and shoots (Tables 2 and 3 ). The Cd + La-treated SGECd t plants had higher root Cd content and shoot Fe, Zn and B contents, as compared with the wild type. In the presence of Cd, treatment with La eliminated genotypic differences in root Ca and Mg contents and in shoot Ca, Mg, Mn and Cd contents.
Elimination of Ca from the nutrient solution led to a dramatic inhibition of plant growth and a drop in the plant Ca contents of both genotypes (Fig. 2 ). The extent of inhibition was stronger than the biomass reductions caused by the Cd and/or La treatments (Fig. 2 ). Growth inhibition of the minus-Ca plants was accompanied by disturbances in element composition that were similar for both genotypes (Tables 2 and 3 ).
The data on root and shoot element compositions (percentage changes to untreated plants) were submitted to a correlation analysis that showed a close similarity between both genotypes in their responses to Cd, La and Cd + La treatments ( r varied from + 0·78 to + 0·99; P <0·008; n = 10). No correlation was established between the nutritional disturbances induced by Cd and by La, and alterations in root element compositions correlated with those in shoot element compositions uniquely in La-treated plants ( rSGE = + 0·66; P = 0·04; n = 10 and rSGECdt = + 0·68; P = 0·03; n = 10), suggesting different mechanisms of action of Cd and La on nutrient uptake. In the Cd + La-treated plants, the genotypic difference manifested itself by a positive correlation between root and shoot percentage changes in SGECd t ( r = + 0·70; P = 0·02; n = 10) and by the absence of such a correlation in SGE ( r = + 0·16; P = 0·66; n = 10).
Biochemical parameters indicate lower levels of Cd-stress manifested in SGECd t
In Cd-untreated SGECd t plants, the total GSH contents were higher in roots and tended to be higher in leaves than in those of the wild type (Table 4 ). Respectively, an oxidized form of root GSH and a reduced form of leaf GSH contributed to the elevated GSH contents in the mutant. Treatment with Cd decreased the root GSH contents of both genotypes and eliminated the observed genotypic differences. In the absence of Cd, the mutant had increased content of total NPT in the roots (Table 4 ). Upon Cd-treatment significant accumulation of NPT occurred in roots and leaves. While the induction factor was 6·4 in wild-type roots, NPT increased only 1·7-fold in the Cd-treated mutants. The corresponding figures for the leaves were 1·8-fold for the wild type and 1·5-fold for the mutant. The difference between NPT and GSH in the presence of Cd are used to tentatively describe phytochelatin contents ( PCcalculated ; Metwally et al. , 2005 ). Contents of ( PCcalculated ) = ( NPT )−( GSH ) were 68 % lower in SGECd t roots than in those of the wild type and by 13 % in shoots, respectively (data not shown).
Content of glutathione and non-protein thiols in SGE and SGECd t plants grown in hydroponic culture
| Genotype | Root | Leaf | ||
|---|---|---|---|---|
| Untreated | Cd-treated | Untreated | Cd-treated | |
| Total glutathione (nmol SH g −1 f. wt) | ||||
| SGE | 304 ± 15 | 131 ± 13* | 180 ± 19 | 240 ± 24 |
| SGECd t | 373 ± 20 † | 144 ± 22* | 267 ± 38 | 245 ± 37 |
| Reduced glutathione (nmol SH g −1 f. wt) | ||||
| SGE | 129 ± 25 | 120 ± 16 | 133 ± 17 | 188 ± 26 |
| SGECd t | 137 ± 23 | 86 ± 19 | 210 ± 43 | 188 ± 31 |
| Oxidize glutathione (nmol SH g −1 f. wt) | ||||
| SGE | 175 ± 24 | 11 ± 5* | 47 ± 15 | 52 ± 9 |
| SGECd t | 236 ± 20 † | 58 ± 29* | 57 ± 18 | 57 ± 12 |
| Total non-protein thiols (nmol SH g −1 f. wt) | ||||
| SGE | 611 ± 44 | 3917 ± 99* | 1575 ± 40 | 2822 ± 135* |
| SGECd t | 754 ± 45 † | 1316 ± 92* | 1688 ± 123 | 2488 ± 95* |
The plants were grown for 10 d in the absence (Untreated) or presence of 3 µ m CdCl 2 (Cd-treated). The data are the mean ± s.e. of three experiments with one to three determinations each.
*Shows significant effect of Cd-treatment on a given pea genotype (Student's t -test, P ≤0·05).
† Shows significant difference between pea genotypes for untreated and Cd-treated plants, respectively (Student's t -test, P ≤0·05).
To assess the stress level encountered by the wild-type and mutant plants, three general stress markers were quantified during growth in the presence and absence of Cd. Without Cd, the activities of POX and chitinase, and the free proline concentration in root, as well as leaf POX activity, were similar in SGE and SGECd t plants (Fig. 4 ). Chitinase activity and free proline contents were slightly increased in the SGECd t leaves. Upon Cd treatment, each stress marker increased in roots of both genotypes, albeit little (proline) or at least much less in the mutant than in the wild type. The Cd-induced increases were less in leaves than in roots; in the case of POX, they were also lower in the mutant than in the wild type. The most pronounced difference was seen in the leaf proline contents which almost doubled in the Cd-treated wild type but decreased in the mutant upon Cd treatment (Fig. 4 ).
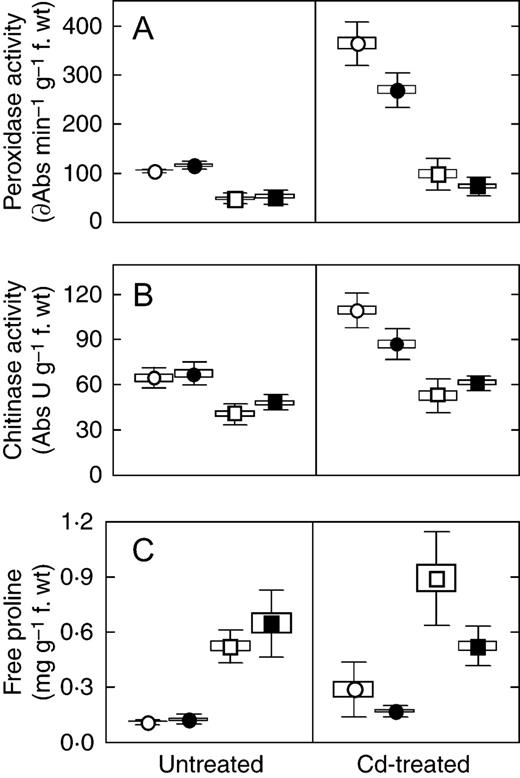
Activity of guaiacol-dependent peroxidase (A), chitinase (B) and content of free proline (C) in SGE (open circles and squares) and SGECd t (closed circles and squares) plants grown for 10 d in nutrient solution in the absence (‘Untreated’) and presence of 3 µ m CdCl 2 (‘Cd-treated’). Plant tissue: root, circles; leaf, squares. Data are the mean ± s.e. (box) and ± s.d. (bars) of two experiments with six determinations each.
DISCUSSION
SGECd t represents a new type of Cd tolerance mutant
The novel and unique mutant of a higher plant with decreased Cd sensitivity was obtained by EMS-mutagenesis and is characterized by a monogenic mutation with a recessive phenotype manifestation. Phenotypic differences were not observed between the wild type and the mutant in the absence of Cd. Irrespective of its improved growth in the presence of Cd, SGECd t showed increased Cd concentrations in all plant parts (root, shoot, leaf, IWF and mesophyll protoplasts) examined and a high ability to accumulate Cd in shoot, showing that the mutant coped well with the increased Cd tissue levels. The SGECd t phenotype is fundamentally different from mutants isolated previously where increased metal sensitivity was linked to decreased Cd contents (Howden et al. , 1995 a ) or enhanced accumulation of Cu ( Van Vliet et al. , 1995 ), Mn ( Delhaize, 1996 ) and Fe ( Welch and LaRue, 1990 ). Increased Cd tolerance and accumulation in naturally occurring populations is mostly linked to altered expression of genes encoding proteins related either to transport, sequestration or detoxification, resulting in lowering the metal contents of the symplast ( Li et al. , 2002 ; Song et al. , 2004 ; Verret et al. , 2004 ; Mills et al. , 2005 ). The distinct properties of these mutants and transgenic plants as compared with those of SGECd t imply that it represents a new mutant type with altered Cd sensitivity.
A significant role of vacuolar compartmentalization in tolerance and accumulation of Cd was demonstrated in yeast ( Persans et al. , 2001 ) and transgenic Arabidopsis plants ( Song et al. , 2003 ) by the expression of plant genes encoding vacuolar metal transport proteins. The increased intracellular Cd contents in Cd-treated SGECd t leaves suggests that the mutant was able to safely sequester the excess Cd. Unfortunately by the time the experiments were conducted, it was not possible to isolate vacuoles from the Cd-treated pea for several reasons (limited plant material, very low protoplast yield and high variation in vacuole size and density). Future attempts will aim at detailed study of Cd compartmentalization in SGECd t that may give important hints to the mechanisms of its improved Cd tolerance.
Biochemical markers indicate decreased Cd-induced stress in the mutant
The level of Cd stress encountered by SGE and SGECd t plants was quantified by use of the stress-markers chitinase, POX and proline. Previously it had been demonstrated that the activity of these markers negatively correlated with Cd tolerance and positively correlated with Cd-induced oxidative stress in a set of pea genotypes ( Metwally et al. , 2005 ). Accumulation of free proline is a non-specific plant response to various stress factors, including HM toxicity, that contributes to protection of proteins, regulation of osmotic potential, cytosolic pH and the NAD(P) + : NAD(P)H ratio, and serves as a carbon and nitrogen source ( Sharma and Dietz, 2006 ). Free proline concentration often increases with increasing metal concentrations in the rooting medium and closely correlates with plant growth inhibition ( Schat et al. , 1997 ). The lower level of Cd-induced chitinase and intracellular POX activities and proline accumulation seen in the SGECd t mutant reflects on lower extent of stress, as compared with wild-type SGE. Differential alterations in biochemical markers in the Cd-treated mutant and the wild type are in agreement with the data on growth parameters, Cd and nutrient uptake and accumulation of NPT. They support the view that the mutant may be characterized as a Cd-insensitive plant coping well with high internal Cd concentrations. At the same time, slight increases in POX and chitinase activities and in proline content, particularly in SGECd t shoots in the absence of Cd, indicate that the mutation has affected stress-related metabolic pathways of the mutant under non-stress conditions.
Increased Cd accumulation and tolerance are not linked to glutathione and PCs
Non-protein thiols are important components of defence to various stressors including HM stress ( Cobbett et al. , 1998 ). Glutathione acts as a precursor for the biosynthesis of PCs, which form complexes with Cd and other HMs, resulting in detoxification of HM ions ( Clemens et al. , 1999 ), and protect cells from free radicals ( Noctor and Foyer, 1998 ). Metwally et al. (2005) reported that Cd-sensitive pea genotypes responded to Cd toxicity by decreased GSH content, whereas opposite responses were observed in Cd-tolerant genotypes. The marginal differences in GSH contents between SGE and SGECd t indicate that the mutation somehow affected GSH metabolism in the mutant. However, GSH contents under Cd stress conditions were indistinguishable, ruling out a major contribution of GSH in establishing the mutant phenotype. Likewise, PC accumulation is only partially related to metal tolerance ( Howden et al. , 1995 b ; Clemens et al. , 1999 ); for example, no correlation was seen between Cd tolerance and PC accumulation ( De Knecht et al. , 1994 ; Metwally et al. , 2005 ). Moreover, Lee et al. (2003) demonstrated that Arabidopsis overexpressing PC synthase gene AtPCS1 became more sensitive to Cd, probably due to the toxicity of high PC concentrations present in the plant tissues. The decreased Cd-induced accumulation of PCcalculated in SGECd t mutant excludes the fact that Cd tolerance of the mutant was due to increased biosynthesis of PCs. The results rather indicate that binding of Cd by PCs and GSH is not sufficient to protect wild-type SGE against Cd toxicity, and most probably is not an efficient mechanism for detoxification of higher Cd concentrations in the SGECd t mutant.
SGECd t is efficient in cation homeostasis
Cadmium is known to significantly disturb element uptake and distribution in pea ( Sandalio et al. , 2001 ; Metwally et al. , 2005 ). The high ability of the Cd-treated SGECd t mutant to maintain homeostasis of several nutrient elements, particular Ca, Mg, Zn and Mn, is the most peculiar trait associated with the mutant and might be the direct cause of its tolerance. Calcium is a critical signalling component playing an important role in plant responses to abiotic and biotic challenges ( White and Broadley, 2003 ). Actually perturbations in intracellular Ca levels have been directly linked to Cd, Zn and Cu toxicity ( Perfus-Bardeoch et al. , 2002 ; Kinraide et al. , 2004 ). Decreased Cd phytotoxicity caused by Ca was accompanied by either inhibited Cd uptake ( El-Enany, 1995 ; Zhao et al. , 2002 ) or enhanced biosynthesis of PCs ( He et al. , 2005 ); however, the SGECd t mutant has increased Cd uptake and reduced PCcalculated accumulation. Similar to that of Ca 2+ , imbalance in Mg 2+ homeostasis leads to serious disruptions in plant metabolism ( Shaul, 2002 ), and Mg application alleviates negative effects of excess Zn, Cu and Al on plants ( Kinraide et al. , 2004 ). Zinc, being an important micronutrient, is involved in the protection of plants against oxidative stress ( Cakmak, 2000 ) that is also associated with Cd toxicity ( Metwally et al. , 2005 ; Rodriguez-Serano, 2006 ). Based on these data, it is proposed that maintenance of nutrient homeostasis in Cd-treated SGECd t contributes to its increased Cd tolerance. In addition, a crucial effect of Ca homeostasis for pea growth was illustrated by the dramatic reduction in biomass of Ca-deficient wild-type and mutant plants.
Ca and Mg channels are often permeable to other cations including Cd ( White, 2000 ; Perfus-Barbeoch et al. , 2002 ; Zhao et al. , 2002 ), although Zhao et al. (2002) proposed the existence of a highly selective Cd-transporter in the Cd-hyperaccumulating ecotype of T. caerulescens . Here, to test for the involvement of cation transporters in SGECd t nutrient homeostasis, the plants were treated with La, an inhibitor of Ca channels ( White, 2000 ). Lantanum not only altered the homeostasis of Ca but also that of several other nutrients in both genotypes. This effect could be related to: ( a ) the ability of Ca channels to transport other ions; ( b ) the direct inhibition of other ion transporters by La action; ( c ) the disturbance of Ca status and Ca signalling; or ( d ) the toxic effects of La on metabolism apart from the inhibition of ion transport systems. The La-induced decrease in shoot biomass and nutrient contents was more pronounced in SGE than in the mutant. In the presence of Cd, the additional treatment with La significantly decreased the Cd-induced genotypic differences in growth parameters and nutrient contents. The results showed that the SGECd t possessed increased La tolerance and suggest that the observed genotypic difference in Cd tolerance may partially be associated with a more severe disturbance of nutrient status in Cd-treated wild-type plants. However, the increased Cd tolerance of SGECd t is unlikely to be fully explained by improved uptake of nutrient elements under Cd stress, because root element composition of La + Cd-treated wild-type and mutant plants was rather similar, but the mutant root biomass was still more than twice that of the wild type. In addition, secondary effects caused by the better root growth might contribute to the improved nutrient homeostasis of Cd-treated SGECd t . Treatment with La + Cd significantly decreased root and shoot Cd content in both pea genotypes. This effect correlated with an earlier observation on a reduced Cd uptake in L. sativa plants upon treatment with La ( He et al. , 2005 ). However, reduction of toxic Cd concentrations in plants treated with La + Cd did not alleviate growth inhibition, supporting the view that the ability to maintain nutrient homeostasis under Cd stress is important for expression of the SGECd t phenotype.
The results of growth performance and elemental analysis allow us to propose that: ( a ) inhibition of nutrient uptake in wild-type SGE significantly contributes to Cd-induced growth reduction of wild-type SGE; ( b ) the ability of the SGECd t to counteract Cd-induced disturbances in nutrient uptake enhances growth under Cd stress; ( c ) the nutrient ion profiling at sufficient and low Ca 2+ supply indicates that the mutant translocation phenotype is mainly expressed in the presence of toxic metal concentrations and is inconspicuous under metal-free growth conditions. To find out if the mutated gene is or is not involved in the regulation of permeability of ion channels and/or transport of nutrient elements (and Cd) from root to shoot needs further investigation.
CONCLUSIONS
This article presents the first higher-plant mutant with increased Cd tolerance and Cd accumulation. The performed physiological, biochemical and elemental analysis of the SGECd t mutant suggests that this phenotype may be described as a Cd-insensitive plant coping well with high internal Cd concentrations and showing decreased stress response symptoms in comparison with the wild type. The ability of SGECd t to tolerate and accumulate Cd makes SGECd t a promising new genetic material with a perspective for phytoremediation of heavy-metal-polluted soils. However, future studies are necessary to identify the mechanism(s) of Cd tolerance in this mutant.
ACKNOWLEDGEMENTS
We are very grateful to Ms Elfriede Reisberg for ICP-AES measurements and Ms Nadezhda Yablunina for plant N content determinations. This work was supported by the EU-RTD INCO Copernicus (project IC15-CT 98-0116), by the INTAS (project 01-2170 PC 2001), the St Petersburg Government (2004), and by the St Petersburg Government Fellowship to V.E.T. (PD04-1/4-230).
