

Abstract
This study uses responses to a 2017 survey of row crop producers in Middle and West Tennessee to analyze producer perceptions of the likelihood that no-till or cover crop adoption would generate economic, soil health, and water quality benefits. Respondents believed that using either no-till or cover crops was likely to reduce soil erosion, retain soil moisture, and improve soil health and water quality, but not increase yields or decrease yield variability. Respondents were more likely to use no-till than planting cover crops and generally believed that no-till was more likely to improve soil health and increase water quality benefits than cover crops. Middle-aged respondents who had a college education and used irrigation were more likely to associate no-till adoption with soil health benefits. Respondents familiar with cost-share programs that encourage cover crop adoption and those who practiced no-till cultivation were more likely to associate cover crops with positive soil health and water quality outcomes. Collectively, these results can inform the design, implementation, and evaluation of research and educational programs to enhance understanding of the effects of no-till and cover crop use and public policies to promote the adoption of these practices.
Introduction
No-till and cover crops have been widely promoted as ways to reduce soil erosion and improve water quality (Triplett and Dick 2008; Daryanto et al. 2018). In no-till systems, the seed is planted directly into untilled soil and residue from the previous crop. No-till reduces erosion by maintaining soil structure and cover and increasing water absorption and infiltration (Spears 2018; Duyck and Petit 2016; Uri 2000; Triplett and Dick 2008). Cover crops are crops grown between cash crops to reduce erosion from bare fields, retain soil moisture, add organic matter to the soil, and control weeds (Balkcom et al. 2007; Barth 2015; Daryanto et al. 2018; SARE 2015; SARE and CTIC 2016, 2017).
However, the adoption of no-till and cover crops by US farmers remains relatively low. In 2012, 30.6% of US cropland was managed with no-till, while only 3.3% of US cropland was planted with cover crops (USDA 2014a). By 2017, no-till use had increased to 32.6% and cover crop plantings to 4.8% of US cropland (USDA 2019). There is, however, considerable geographic heterogeneity in no-till and cover crop usage (Claassen et al. 2018; Wade et al. 2015). For example, in Middle and West Tennessee, approximately 66% of the cropland was farmed using no-till in 2017, while 8% of the cropland was planted in cover crops (USDA 2019). Consistent estimates of tillage practice adoption rates are difficult to come by due, in part, to inconsistent definitions of these practices. While other estimates of no-till adoption may differ (USDA 2018; Wade et al. 2015; Claassen 2018), the numbers reported here apply to all cropland and are consistently calculated over time and space.
Widespread no-till adoption in this region has been attributed to the cost savings associated with no-till (Smith and Bowling 2021) and the combination of highly erodible soils (Denton and Tyler 2002) and provisions in the 1985 Farm Bill requiring soil conservation systems on highly erodible farmland (USDA 2014b). More generally, no-till adoption has been spurred by the cost advantages of no-till over other conservation methods (Denton and Tyler 2002) and the development of glyphosate-resistant crops (Young 2006; Held et al. 2016).
One approach to understanding farmer adoption of no-till and cover crops is to focus on producer perceptions of these practices’ effects on their farming operations. The nature and extent of these effects and producer perceptions of them vary by region and farmer. Some studies have found that no-till adoption can reduce yield variability and boost yields in dry years (Soil Health Institute 2018; Regoli 2019), but other studies have found that the effects on yield vary based on differences in local climate and soils (Triplett and Dick 2008; Toliver et al. 2012). Similarly, the evidence of the effect of cover crops on cash crop yields is mixed, as studies have found positive (SARE and CTIC 2016, 2017), no (Zhou et al. 2017), and negative (Lira and Tyner 2018) effects on yields. The variety of ways in which these practices affect producer operations further complicate adoption decisions. For example, while no-till adoption generally reduces labor and fuel costs (Uri 2000; Creech 2017; Smith and Bowling 2021), it likely increases herbicide use (Triplett and Dick 2008; Regoli 2019; Smith and Bowling 2020). Similarly, while cover crops can generate cost savings from reduced fertilizer use, these cost savings may not be enough to offset the costs associated with planting and terminating cover crops (Zhou et al. 2017; Boyer et al. 2018). Studies of producer perceptions suggest that farmers generally believe that no-till and cover crop adoption can benefit soil resources but have less confidence in these practices’ ability to generate yield or financial benefits (Al-Kaisi et al. 2000; Lowry and Brainard 2017; O’Connell et al. 2015).
This research uses data from a 2017 survey of Middle and West Tennessee row crop producers to analyze producer perceptions of the likely effects of adopting no-till and cover crops on their farming operations. The survey’s primary purpose was to collect information on producer willingness-to-adopt these practices, but it also included questions on respondents’ perceptions of practice effects. This research uses responses to these questions to increase understanding of the extent to which producer perceptions differ between no-till and cover crops and between users and nonusers of these practices. Widespread adoption of no-till among Middle and West Tennessee producers also enables a more general comparison of producer perceptions of a mature, widely adopted technology (no-till) with a newer, less familiar one (cover crops). Insight into farmer beliefs or misconceptions about the practices can inform the design, implementation, and evaluation of (1) research about the effects of their adoption on farm operations and resources and (2) policies and outreach programs designed to promote their adoption. More specifically, the results of this research can help researchers and extension educators identify barriers to adopting these practices and develop research and outreach programs to address these barriers.
Materials and Methods
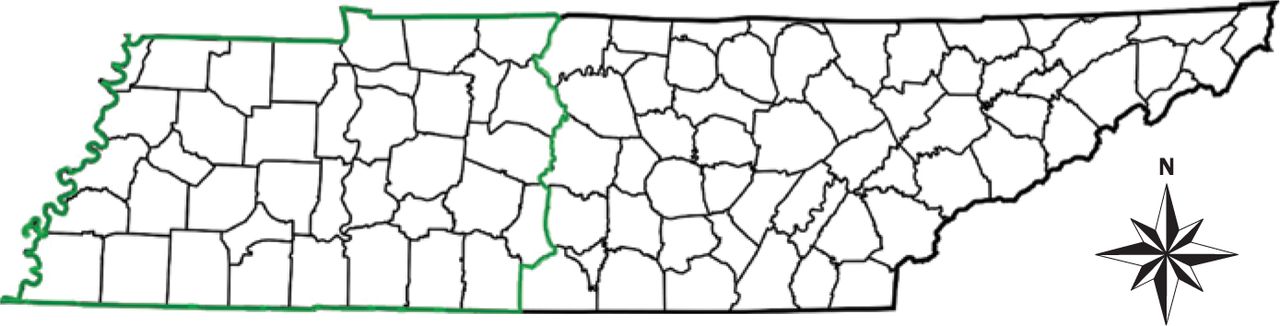
Data. This study’s survey sample was obtained through a Freedom of Information Act request for the mailing addresses of landowners and corn (Zea mays L.), cotton (Gossypium hirsutum L.), soybean (Glycine max [L.] Merr.), and wheat (Triticum aestivum L.) producers in Middle and West Tennessee who received a Farm Service Agency (FSA) payment between 2012 and 2016 (Campbell et al. 2021; figure 1). On January 26, 2017, a postcard was sent to these producers, notifying them to expect the mail survey. On February 8, 2017, a cover letter, insert (explaining the benefits and requirements of using winter cover crops, no-till, and irrigation water management), survey questionnaire, and postage-paid return envelope were mailed to 5,184 producers and landowners. A reminder postcard was sent on February 17, 2017. A second round of surveys was sent to nonrespondents on March 8, 2017. After eliminating undeliverable addresses and individuals who replied that they did not farm, the survey sample was 3,841. The response rate was 9%, with 346 survey responses received (Campbell et al. 2021). The number of useable responses varied across the analyses performed but consistently fell below 346 due to missing answers.

Map of Middle and West Tennessee counties.
The survey questionnaire consisted of six sections. The first section included questions related to owned and leased land, crop yields, and production costs. Questions about producer experiences with and perceptions of no-till, cover crops, and irrigation management comprised the second, third, and fourth sections, respectively. The fifth section elicited risk preferences. The sixth and final section focused on farmer demographics.
One of the questions on perceptions of no-till asked respondents to indicate the likelihood that using no-till on their farm would lead to various outcomes, i.e., “How likely is each of the following to occur from using no-till on your farm?” The section on cover crops contained an almost identical question about the likely effects of using cover crops. Both questions asked respondents to indicate likelihood on a Likert scale comprised of five response options (0% to 25%, 25% to 49%, 50%/50%, 51% to 75%, and 76% to 100%). Respondents were also given a “No Idea” response option. The outcomes included in the two questions were similar but not identical. Both questions asked how likely using the management practice was to increase yield, reduce yield variability, retain soil moisture, reduce erosion, control weeds, and improve soil quality and health. The no-till question also asked about the likelihood of no-till use reducing costs, and the cover crops question asked about the likelihood of cover crops use increasing profit. Similarly, while the no-till question asked about increasing management burden, the cover crops question asked about increasing planting difficulty. For the purposes of the statistical analyses, the differences between the no-till and cover crop versions of these last two outcomes were ignored.
Respondent perceptions of the likelihood of these effects occurring due to no-till or cover crop use were analyzed by comparing perception means and regressing farm and farmer characteristics on farmer beliefs. Means were calculated by coding responses as “one” for respondents who believed the effect was 0% to 25% likely to occur; “two” for those who believed the effect had a 25% to 49% chance of occurring; “three” for those who believed it was equally as likely to occur as not to occur; “four” for those who believed it was 51% to 75% likely to occur; and “five” for those who believed it was 75% to 100% likely to occur. Respondents who chose the “No Idea” response option were excluded from these calculations.
Analysis of Variance for Perceptions. We first conducted an analysis of variance (ANOVA) on the mean values from the responses to the questions eliciting respondent perceptions of the likely effects of no-till and cover crop use on their farms. The resulting mean values were first considered on their own to determine which events respondents believed were likely or unlikely to occur (i.e., the mean value is greater or less than three). Next, we compared mean values across no-till and cover crops to determine which effects respondents perceived to be the most or least likely to occur. One-way analysis of variance and Tukey’s post hoc test (Abdi and Williams 2010) were used to determine the statistical significance of differences in means across effects.
Means were also compared between users and nonusers for each practice to analyze variation in perceptions across these two groups. Two-sample t-tests were used to determine the statistical significance of differences in means across the two groups. To determine whether there was a significant difference between mean user and nonuser awareness of the likelihood of each outcome occurring, the share of respondents in each group choosing the “No Idea” response were also compared between the two groups.
Ordered Probit Regression. Farm and farmer characteristics were regressed on respondents’ perceptions of the likelihood of the effects occurring to analyze the factors influencing respondents’ perceptions of these likelihoods. Farm and farmer characteristics included producer age (age and age2), educational attainment (edu), farm income (income and income2), and total farmed acres (size and size2), and if the producer had either identified herbicide-resistant weeds (weeds) on the fields they managed, used irrigation (irrigation), or planted either no-till (no-till) or cover crops (cover crops) in 2016. The variable no-till was not included in the models of perceptions of the effects of using no-till since it is likely to be simultaneously determined. Similarly, cover crops does not appear in the regression models. Table 1 provides variable definitions.
Variable definitions.
Another characteristic that might influence producer perceptions of these practices is whether the respondent knew about programs encouraging the adoption of cover crops and no-till or had received a cost share to implement the practice. We included the variable yy to indicate a producer received a cost share for no-till and cyy if they had received a cost share for cover crops. Similarly, the variables yn and cyn indicate whether the producer knew about programs that encouraged adopting these practices through cost-share incentives but did not receive a cost share.
The ordered probit regressions are specified as: 1
1
 2
2
where  is a farmer’s perception of the likelihood using no-till would have the ith effect, and
  is a farmer’s perception of the likelihood planting cover crops would have the ith effect. The ε are random error terms with an expected value of zero and a constant variance of one.
Finally, we analyzed the factors influencing whether respondents believed no-till was more likely to generate a particular outcome than cover crops. Farm and farmer characteristics were regressed on perception. Perception is equal to one if the respondent believed using no-till was more likely to have the effect than planting cover crops, two if the respondent thought the practices were equally likely to have the impact, and three if the respondent believed using no-till was less likely to have the impact than planting cover crops (table 1). The resulting ordered probit model is specified as equation 3: 3
3
where  indicates whether the respondent believed the outcome was more, less, or equally likely to occur from the adoption of cover crops than from the adoption of no-till, and ε is an error term.
Results and Discussion
No-till and cover crop usage appear to be much more common among respondents than among the target population. A total of 87% of the respondents reported using no-till in 2016, while 29% planted cover crops. According to the Census of Agriculture (USDA 2019), 24% of the harvested cropland operations in the study area used no-till in 2017, while 12% used cover crops. This finding could suggest bias in the survey sample, which was limited to farmers who received FSA payments. It could be that farmers who received FSA payments were more likely to be using no-till or planting cover crops than the population of row crop farmers as a whole. This finding could also suggest response bias if farmers who used cover crops or no-till were more likely to complete and return the survey. Survey respondents reported approximately 197,400 farmed ac (79,885 ha), of which 135,000 ac (54,633 ha) were planted in no-till and 22,300 ac (9,024 ha) in cover crops. Thus, adoption rates for survey respondents—expressed in terms of acres planted—were 68% for no-till and 11% for cover crops. According to the 2017 Census of Agriculture, 66% of the cropland in the study area was farmed using no-till, while 8% was planted in cover crops (USDA 2019). Thus, the survey sample appears to be generally representative of the target population in terms of area covered by the practices.
The distribution of farmer age among survey respondents is similar to that of the study region’s farm population as reported in the 2017 Census of Agriculture (USDA 2019). On the other hand, the distribution of farm size among survey respondents skews toward larger farms than reported in the 2017 Census of Agriculture (USDA 2019), perhaps indicating that operators of larger farms were more likely to participate in federal farm programs or to complete and return the survey.
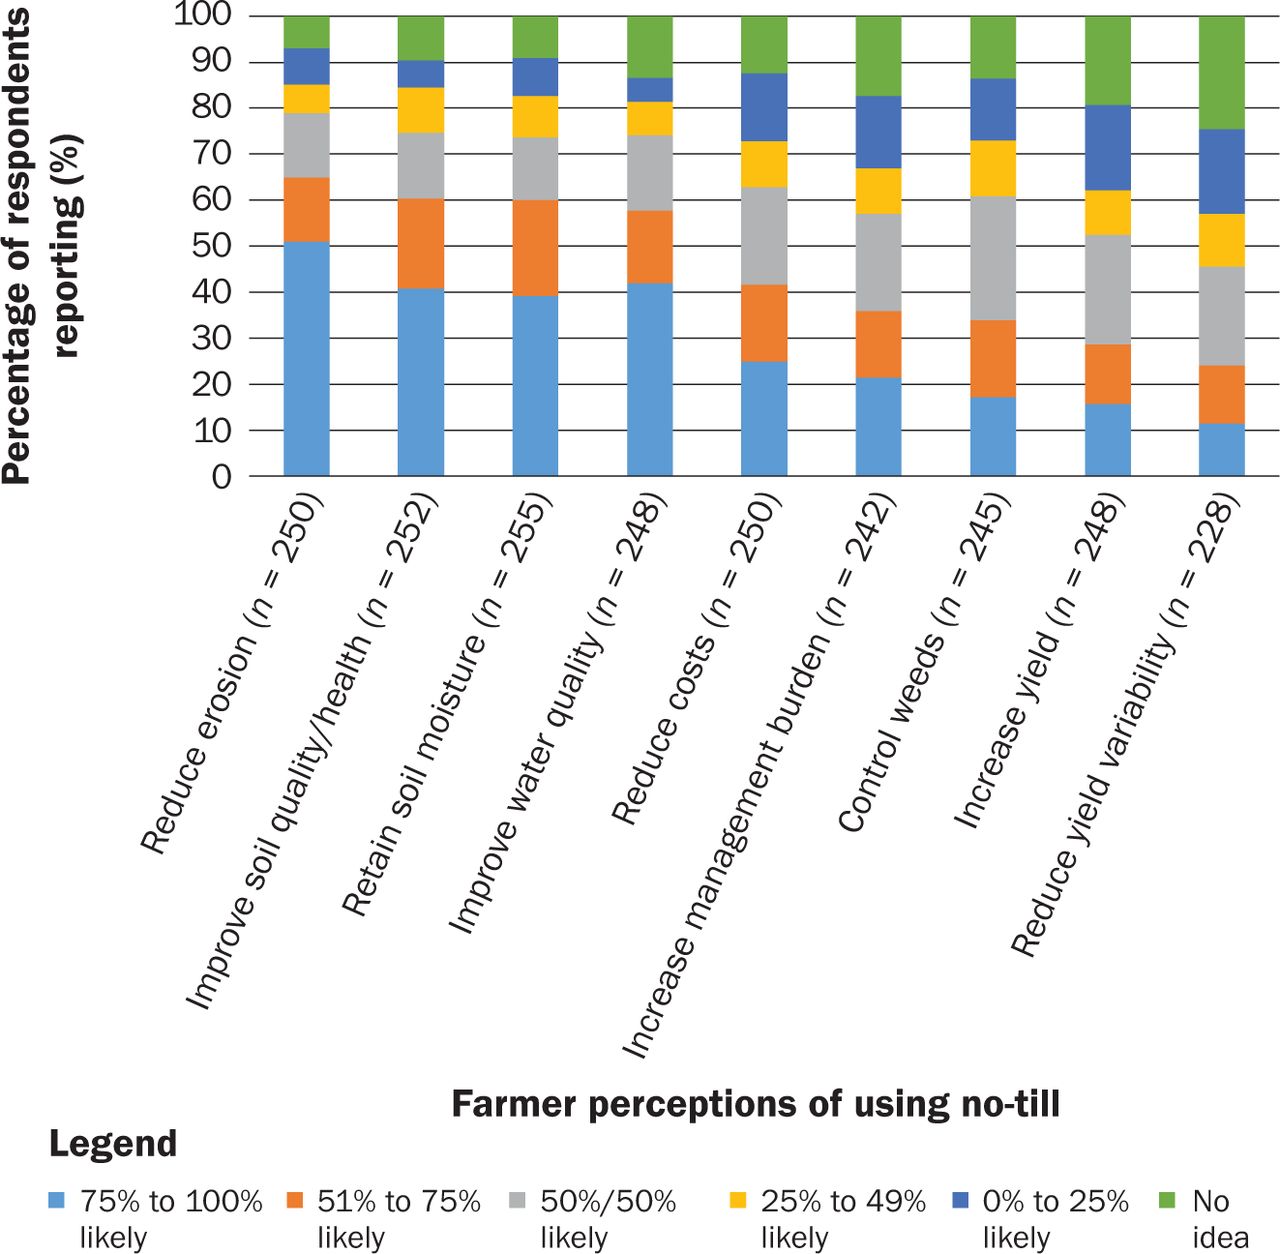
More than half of the respondents believed adopting no-till was more likely to reduce soil erosion, improve soil quality/health, retain soil moisture, and improve water quality (figure 2). On average, respondents believed that reducing erosion and improving soil and water quality were more likely to occur because of no-till adoption than other effects (table 2). A majority of respondents perceived each of the effects of using no-till on soil or water quality to be more likely than not to occur (figure 2). However, respondents believed the adoption of no-till was least likely to increase yields or management burden, reduce yield variability, or control weeds (table 2).

Distribution of respondent perceptions regarding the likelihood of outcomes to occur from using no-till.
Mean perception and awareness of likelihood of outcome occurring as a result of no-till adoption across no-till users, nonusers, and all respondents.
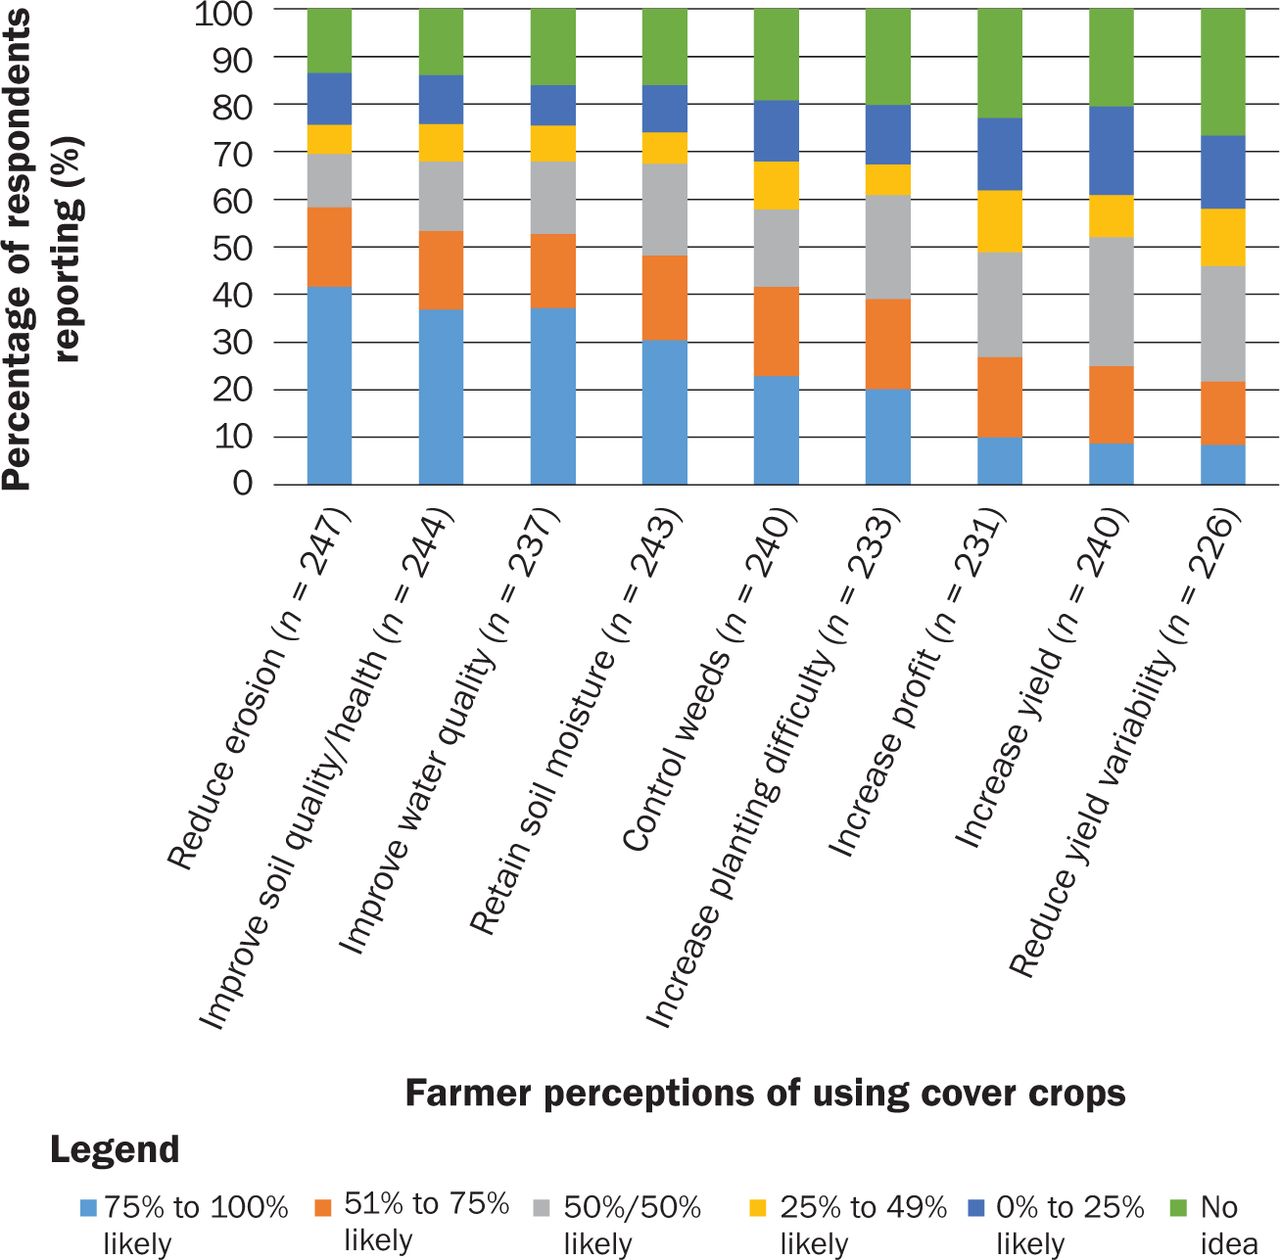
More than half of the respondents believed planting cover crops would be more likely to reduce erosion and improve both soil quality and soil health and water quality (figure 3). On average, respondents perceived cover crops to be most likely to reduce soil erosion, increase soil moisture retention, and improve soil and water quality (table 3). A majority of respondents perceived these three effects to be more likely than not to occur (figure 3). On average, respondents believed the adoption of cover crops was least likely to increase yields and reduce yield variability (table 3). A majority of respondents thought cover crops were less likely to reduce yield variability or increase profit (figure 3).

Distribution of respondent perceptions regarding the likelihood of outcomes to occur from using cover crops.
Mean perception and awareness of likelihood of outcome occurring as a result of cover crop adoption across cover crop users, nonusers, and all respondents.
On average, both no-till and cover crop users were more likely than nonusers to believe that practice adoption would lead to all but one of the possible outcomes, increasing management burden (tables 2 and 3). Similarly, in terms of perceptions of the likelihood of the effects occurring, both no-till and cover crop users were more likely to have an opinion than nonusers (tables 2 and 3).
The mean values of the perception that the likelihood of no-till and cover crop use to reduce erosion and improve soil and water quality suggest that the primary arguments for no-till and cover crops are not a matter of controversy among Middle and West Tennessee row crop producers (table 4). Belief in the efficacy of no-till and cover crops in reducing erosion and improving soil quality is unsurprising, given the research supporting the links. The similarity of the findings across no-till and cover crops may bode well for future cover crop adoption rates. The strength of the belief that no-till and cover crop adoption would improve water quality may be a testament to previous and ongoing outreach efforts in the region. Respondent belief that no-till adoption would enhance soil moisture retention is also supported by previous research (Soil Health Institute 2018; Regoli 2019).
Mean perception and awareness of likelihood of outcome occurring from adoption of no-till or cover crops for all respondents.
The percentages of respondents indicating they had “No Idea” about the likelihood of no-till decreasing yield variability (25%), increasing yield (19%), or increasing management burden (17%) were higher than those for the other possible effects of no-till (table 2 and figure 2). Similarly, a greater share of respondents indicated they had “No Idea” whether using cover crops would decrease yield variability (27%), reduce costs (23%), increase yield (20%), or increase management burden (20%) (table 3 and figure 3).
Not surprisingly, both no-till and cover crop nonusers were more likely than users to choose the “No Idea” response option (tables 2 and 3). The relatively high percentage of nonusers selecting this option, typically 40% to 60%, suggests there may still be potential to increase adoption through outreach programming. In general, the mean values follow similar patterns for no-till and cover crop adoption. However, cover crop nonusers generally believe that cover crop adoption would have positive impacts (mean values > 3), while no-till nonusers typically did not (mean values < 3). Similarly, cover crop nonusers appear to have been less likely to choose the “No Idea” response option than no-till nonusers. These distinctions may suggest that farmers who believe that no-till yields benefits have already adopted it. Still, many respondents who believe that cover crops generate farm resource and financial benefits have not yet adopted them for various reasons.
Ordered Probit Results. Table 5 summarizes the results of the ordered probit models. On average, farmer belief in the likelihood that no-till reduces erosion, improves soil quality and health, and enhances water quality increases with producer age (age) up to 49, 51, and 55 years, respectively, after which it declines. Producers with greater educational attainment levels (edu) were more likely to believe that no-till increases yields, reduces yield variability and costs, controls weeds, and improves soil quality/health and water quality. Higher levels of farm income (income) are associated with an increased belief in the likelihood of no-till adoption reducing costs. Producers who grew cover crops in 2016 (cover crops) were more likely to believe no-till adoption would increase soil moisture retention. Producers who irrigated crops in 2016 (irrigation) were more likely to think no-till adoption would increase soil moisture retention, reduce erosion and costs, control weeds, and improve soil quality/health and water quality. Finally, producers who knew about, but had not received, a cost-share payment for no-till adoption (yn) were less likely to believe that no-till adoption would improve soil quality/health.
Parameter estimates for farmer perceptions of the effects of using no-till from ordered probit models.
In general, middle-aged, more educated producers and those who irrigated cropland in 2016 were more likely to believe in the primary biophysical benefits of no-till, i.e., reduced erosion, improved soil quality and health, and improved water quality. Producers with greater levels of educational attainment were also more likely to believe in other benefits of no-till, e.g., reduced yield variability and reduced costs and weed control. Perceptions were mostly unaffected by farm income and size, experience with herbicide-resistant weeds, the use of cover crops or knowledge of, or experience with cost-share incentives for no-till adoption. Similarly, perceptions of the likelihood of no-till adoption increasing yields, increasing managerial burden, or reducing yield variability or soil moisture retention were mostly unaffected by differences in farm and farmer characteristics and experiences.
Stronger belief among middle-age respondents in the likelihood of no-till leading to physical benefits is unsurprising, given that the educational efforts promoting no-till may have peaked a few years ago. This finding might suggest the possibility of slippage in no-till use over time without additional educational initiatives. The positive relationship between educational attainment and belief in the likelihood of no-till benefits may be an indicator of receptivity to, or ability to benefit from, educational efforts. The positive coefficients for the use of irrigation could suggest complementarity between the practices, i.e., the benefits of no-till are more significant or more noticeable for producers who irrigate. Alternatively, irrigation use and producer belief in the benefits of no-till may be codetermined. The factors that lead Tennessee producers to believe in the benefits of and adopt irrigation may also lead producers to believe in the benefits of no-till.
On average, belief in the likelihood that the adoption of cover crops increases soil moisture retention and reduces erosion increases with producer age (age) up to the ages of 46 and 49, respectively, after which it declines (table 6). Higher levels of farm income (income) are associated with a decreased belief in the likelihood of cover crop adoption improving water quality. Farm size (size) was positively associated with increased confidence in the likelihood of cover crop use reducing erosion. Producers who no-till planted in 2016 (no-till) were more likely to believe cover crop use would increase yield, retain soil moisture, reduce erosion, control weeds, improve soil and water quality, and increase management burden. Producers who irrigated crops in 2016 (irrigation) were more likely to believe cover crop adoption would increase yield. Producers who identified herbicide-resistant weeds on their farm (weeds) were more likely to believe cover crop adoption would increase managerial burden. However, producers who knew about, but had not received, a cost-share payment for cover crop adoption (cyn) were less likely to believe that cover crop adoption would increase managerial burden. Finally, producers who knew about, and had received, a cost-share payment for cover crop adoption (cyy) were more likely to believe that cover crop use would increase yield, reduce yield variability, reduce erosion and costs, control weeds, and enhance soil and water quality.
Parameter estimates for farmer perceptions of the effects of using cover crops from ordered probit models.
In general, producers who were middle-aged, used no-till, and knew about and had received a cost-share payment for cover crops were more likely to believe in what might be considered the primary benefits of cover crops, i.e., reduced erosion, improved soil quality/health, and improved water quality. Producers who used no-till, or knew about or had received a cost-share payment for cover crop adoption, were more likely to believe that cover crop conferred benefits. Otherwise, perceptions of the effects of cover crop adoption were mostly unaffected by differences in farm and farmer characteristics or experiences.
Farm size positively correlated with the belief that cover crops would reduce erosion seems to conform to expectations. The positive coefficients for no-till may suggest complementarity, or a predisposition toward technological innovation. However, given the large share of respondents who have adopted no-till, it is unclear how much should be made of this finding. One might expect cost-share programs to be a source of information for producers. Farmers familiar with cost-share programs might be more likely to believe in the physical benefits of use. However, in this case, the coefficients for knowledge of the cost-share program alone were insignificant, while those for knowledge of, and participation in, the program were significant. These results suggest that the signaling effects of a cost-share program do not have much of an impact on producer beliefs.
Producers with greater educational attainment levels (edu) were more likely to believe that no-till adoption is more or at least as likely as cover crop adoption to increase yield, reduce yield variability and costs, and enhance soil and water quality (table 7). This finding could indicate that producers with greater levels of educational attainment are more likely to be influenced by the region’s more extensive experience with no-till, including hosting the Milan No-Till Field Day (Denton and Tyler 2002). Farm size (size) was positively correlated with the belief that cover crops reduce yield variability and control weeds than does no-till. Producers who had identified herbicide-resistant weeds (weeds) were more likely to think that the adoption of no-till was more than or at least as likely as planting cover crops to increase yield, reduce yield variability, and improve water quality. Perhaps producers who have identified herbicide-resistant weeds on their farms are more likely to view the primary benefit of cover crops being weed suppression and, as a result, less likely to believe cover crops are as likely as no-till to increase yields, reduce yield variability, or improve water quality. Producers who irrigated crops in 2016 (irrigation) were more likely to believe that planting cover crops would control weeds than would no-till adoption. Producers who knew about, and had received, a cost-share payment for cover crop adoption (cyy) were more likely to believe that planting cover crops would improve soil and water quality than would no-till adoption. Finally, producers who knew about, but had not received, a cost-share payment for cover crop adoption (cyn) were more likely to believe that no-till would be at least as likely as cover crop adoption to reduce yield variability.
Parameter estimates for farmer group perceptions of the common effects of using no-till and cover crops from ordered probit models.
In general, more educated producers and farmers who neither knew about nor had experience with cost-share incentives for cover crop adoption were more likely to believe that no-till adoption would improve soil and water quality than would cover crop adoption. Perceptions of the relative likelihood of no-till or cover crop adoption to reduce erosion or improve soil or water quality were mostly unaffected by age, farm income or size, the use of irrigation, or knowledge of, or experience with cost-share incentives for no-till adoption. Similarly, perceptions of the relative likelihood of no-till or cover crop adoption to improve soil moisture retention, reduce costs, or increase management burden were mostly unaffected by farm and farmer characteristics or experiences.
Summary and Conclusions
This study used a 2017 survey of row crop producers in Middle and West Tennessee to analyze farmer beliefs about the effects of no-till and cover crop adoption on their operations. Previous studies concluded that no-till and cover crop planting could help reduce soil erosion, improve water quality, improve soil quality, and control weeds, while the impacts of the practices on crop yields are uncertain (Uri 2000; Balkcom et al. 2007; Daryanto et al. 2018; SARE and CTIC 2016, 2017; Lira and Tyner 2018). Survey results suggest that respondents believed the most likely outcomes from using no-till and cover crops were reducing soil erosion, increasing soil moisture retention, and improving soil health and water quality. Respondents did not generally believe that adopting no-till would reduce yield variability, increase yield, or control weeds. Nor did respondents believe that adopting cover crops was likely to increase profit, increase yields, or reduce yield variability. Thus, respondent perceptions generally align with previous research on the biophysical effects of no-till and cover crops. However, while prior research has suggested that no-till and cover crop adoption can stabilize yields, farmers in Middle and West Tennessee did not generally believe that these practices would reduce yield variability. This discrepancy suggests a need for increased outreach efforts. Given that climate change appears likely to amplify weather and yield uncertainty, additional research and educational programming on the effects of these practices on yield variability may help producers make more informed adoption decisions.
Respondents were more likely to believe in the positive effects of no-till than cover crop adoption, but perceptions of the two practices were remarkably similar. Respondents believed both practices were likely to generate soil and water quality benefits, but they were less convinced that either would generate yield benefits. Differences in the strength of these beliefs across the two practices would appear to be related to the greater familiarity producers have with no-till. Producers who currently use one of the practices are more likely to believe in the practice’s positive effects.
Middle-aged producers, producers with greater educational attainment, and those using irrigation were more likely to believe in the soil health and water quality benefits of no-till adoption. Middle-aged producers and those who used no-till and who knew about and had received a cost-share payment for cover crops were more likely to believe in cover crop soil health and water quality benefits. The greater belief in the benefits of cover crops by producers who use no-till could suggest that the practices are complementary or that those who have observed the benefits of one practice may be more likely to believe in another practice’s potential benefits. This finding highlights the potential benefits of targeting no-till users with outreach programs to promote cover crop adoption in either event. This finding also illustrates the potential spillover benefits associated with successful educational and promotional programs for one technology, in this case, no-till, on other technologies.
In general, these findings provide a clearer understanding of producer perceptions of these practices and the factors that influence these perceptions. This enhanced understanding can inform the design and implementation of research, outreach, and incentive programs related to these practices. In particular, the results can be used by researchers and extension educators to develop research and outreach programs focused on the barriers to producer adoption of soil health management practices. The findings of this research suggests that, for some practice effects, producer perceptions of cause-effect relationships are consistent with field trial research findings. For other practice outcomes, producer perceptions differ from research findings, suggesting the need for additional research and work to communicating evidence-based findings to producers.
Acknowledgements
This research was funded in part by the National Institute of Food and Agriculture, United States Department of Agriculture (USDA), an Agriculture and Food Research Initiative Competitive Grant (Grant number # 2014-08253) titled “Increasing the Resilience of Agricultural Production in the Tennessee and Cumberland River Basins through More Efficient Water Resource Use.”
- Received October 6, 2020.
- Revision received February 15, 2021.
- Accepted March 8, 2021.
- © 2021 by the Soil and Water Conservation Society


